Average Customer Retention Rate By Industry: 2026 Benchmarks
Quick answer
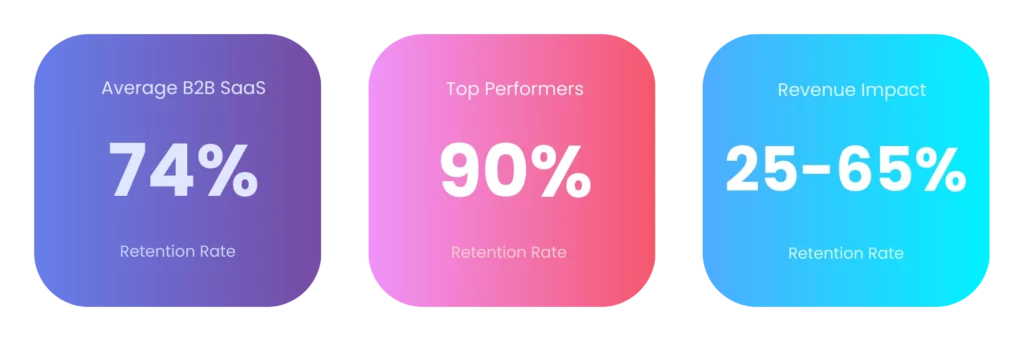
Average customer retention rates range from about 55% in hospitality to 86% in commercial insurance, with B2B SaaS averaging 74% a year. Top SaaS performers retain 90%+ annually, while B2C subscription businesses do well at 70-75%. Benchmark against your own industry first — the cross-sector spread is too wide for a single 'good' number.
Understanding the average customer retention rate by industry helps SaaS companies, subscription businesses, and customer success teams benchmark their performance against competitors.
Retention rates vary dramatically across sectors – from hospitality hovering around 55% to professional services reaching 85% – and knowing where your business stands is the first step toward improving customer loyalty and reducing churn.
What Is Customer Retention Rate?
Customer retention rate measures the percentage of customers a business keeps over a specific period.
The formula is straightforward: divide the number of customers at the end of a period (minus new customers acquired) by the number of customers at the start, then multiply by 100.
For SaaS companies, retention rate directly impacts Monthly Recurring Revenue (MRR), Customer Lifetime Value (CLV), and overall business valuation. A 5% increase in retention can boost profits by 25% to 95%, according to research from Bain & Company.
Average Customer Retention Rate By Industry: 2026 Data
Recent industry benchmarks reveal significant variation in retention performance across sectors. Here’s a comprehensive breakdown of the average customer retention rate by industry based on 2026 data:
| Industry | Average Retention Rate | Key Drivers |
|---|---|---|
| Commercial Insurance | 86% | Long-term contracts, high switching costs |
| Business Consulting | 85% | Relationship-based, trust-driven |
| IT & Managed Services | 83% | Technical integration, service dependencies |
| Software Development | 82% | Project continuity, specialized expertise |
| Construction & Engineering | 80% | Repeat contracts, B2B relationships |
| Real Estate | 78% | Transaction-based but referral-heavy |
| Financial Services | 78% | Regulatory friction, account complexity |
| Telecommunications | 78% | Contract lock-ins, bundled services |
| Healthcare | 77% | Trust, necessity, provider relationships |
| B2B SaaS | 74% | Product stickiness varies by integration depth |
| Automotive | 76% | Service intervals, warranty programs |
| Legal Services | 75% | Ongoing legal needs, trust factors |
| Cybersecurity | 71% | Critical infrastructure dependency |
| Manufacturing | 67% | Price sensitivity, commoditization |
| Retail | 63% | Low switching costs, price competition |
| eCommerce | 62% | High customer acquisition, impulse purchases |
| Hospitality & Travel | 55% | Seasonal demand, discretionary spending |
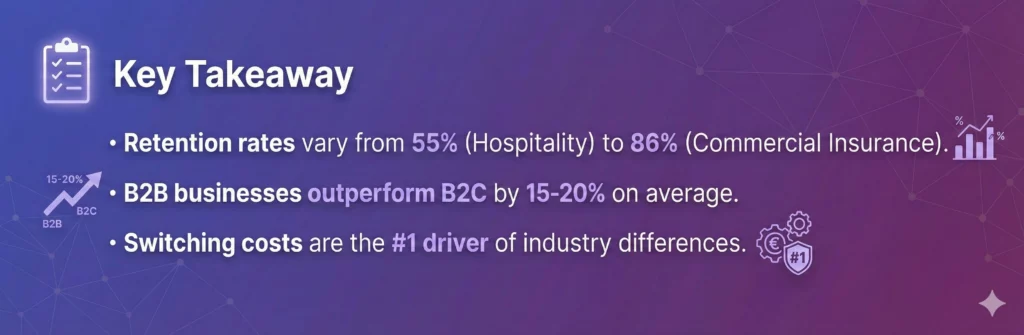
The data shows that B2B businesses and industries with high switching costs consistently outperform B2C and transactional models.
The average customer retention rate by industry ranges from 55% to 86%, with a mean of approximately 75% across all sectors.
Retention Benchmark Spectrum
Hospitality
55%
B2B SaaS
74%
Insurance
86%
Industry retention rates vary by 31 percentage points. Where does your business fall?
Why Industry Benchmarks Matter for SaaS Companies
Comparing your retention rate against industry standards provides context for performance evaluation.
A 70% retention rate might be concerning for an IT services firm but above average for an eCommerce business.
SaaS companies face unique retention challenges. Unlike transactional businesses, subscription models require continuous value delivery.
Product usage patterns, feature adoption, customer health scores, and expansion revenue all influence retention outcomes.
Top-performing B2B SaaS companies achieve 90%+ annual retention rates, with Net Revenue Retention (NRR) exceeding 120% through upsells and expansions.
Where does your retention stack up?
Compare your metrics against these benchmarks with ChurnDefense’s retention dashboard. Track MRR churn, cohort trends, and early warning signals in one view.
Factors That Influence Retention Rates Across Industries
Several variables explain why the average customer retention rate by industry differs so dramatically:
Switching Costs
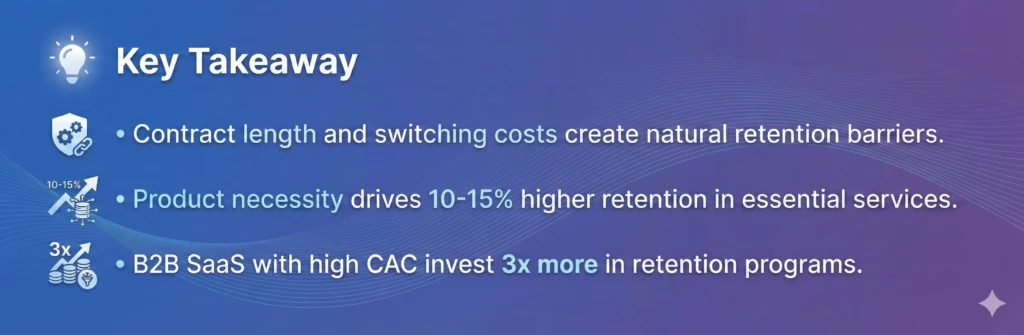
Industries like financial services and enterprise software have high switching costs due to data migration complexity, integration requirements, and learning curves. These friction points naturally boost retention.
Contract Length
Telecommunications and insurance companies benefit from annual or multi-year contracts that create structural retention advantages.
Product Necessity
Healthcare and financial services provide essential services, creating inherent stickiness that discretionary industries lack.
Customer Acquisition Cost (CAC)
Industries with high CAC invest more heavily in retention programs, often achieving better outcomes through dedicated customer success teams.
Business Model
Subscription-based B2B SaaS businesses average 90% retention, while transactional eCommerce models struggle to maintain 38% retention due to lower engagement frequency.
Common Pitfalls When Benchmarking Retention
Many companies make critical mistakes when evaluating their retention performance:
Confusing Logo Retention with Revenue Retention
A company can maintain 85% logo retention while revenue retention sits at 75% if downgrades exceed upsells. Focus on Net Revenue Retention for a complete picture.
Ignoring Cohort Analysis
Aggregate retention rates mask important trends. New customers often churn faster than tenured accounts, making cohort-based analysis essential for accurate measurement.
Mixing Voluntary and Involuntary Churn
Failed payments (involuntary churn) require different interventions than product dissatisfaction (voluntary churn). Separating these categories improves diagnostic accuracy.
Using Inappropriate Time Windows
Monthly retention rates don’t translate linearly to annual figures. A 95% monthly retention rate yields only 54% annual retention due to compounding effects.
FREE RETENTION AUDIT
Is your retention below industry average?
Get a personalized churn risk assessment. We’ll analyze your cohorts, identify revenue leakage, and show you exactly where you’re losing customers.
How to Improve Your Customer Retention Rate
Understanding the average customer retention rate by industry is only valuable if it drives action. Here are proven strategies to boost retention:
Implement Predictive Churn Scoring
Monitor usage patterns, support ticket volume, billing issues, and engagement metrics to identify at-risk accounts 30+ days before cancellation.
Design Effective Onboarding
First-week activation strongly correlates with long-term retention. Define clear “aha moments” and guide customers to early value realization.
Create Segmented Retention Playbooks
High-touch enterprise accounts need different interventions than self-serve SMB customers. Develop plays by customer segment, ARPA tier, and risk level.
Optimize Cancellation Flows
Offer pause options, downgrades, or extended trials instead of immediate cancellations. Ethical save-offers can recover 15-30% of at-risk revenue.
Measure Leading Indicators
Don’t wait for cancellations to measure retention. Track product usage frequency, feature adoption depth, NPS scores, and support satisfaction as early warning signals.
Implementation Steps for Retention Improvement
Start by establishing baseline metrics. Calculate your current retention rate using consistent time windows and customer cohorts.
Separate voluntary churn from involuntary churn to understand root causes.
Next, identify your retention gap relative to industry benchmarks. If your SaaS business sits at 68% retention while the industry average is 74%, closing that 6-point gap represents significant revenue opportunity.
Build a customer health scoring model that combines product usage data, billing status, support interactions, and sentiment signals.
Assign health scores to every account and trigger interventions when scores decline.
Develop retention playbooks for different risk scenarios. Create specific workflows for low-usage customers, payment failures, feature adoption gaps, and competitive threats.
Test these playbooks systematically and measure their impact on save rates.
Finally, establish executive-level retention dashboards that track MRR churn, logo churn, cohort retention curves, and leading indicators.
Review these metrics monthly with cross-functional teams including product, customer success, and sales.

Measuring Retention Success
Track both lagging and leading metrics. Lagging indicators include monthly churn rate, annual retention rate, and customer lifetime value.
Leading indicators encompass product login frequency, feature adoption rates, support ticket trends, and payment health.
Monitor cohort retention curves to understand how retention evolves over customer tenure. Most businesses see elevated churn in months 1-3, followed by stabilization for retained accounts.
Calculate Net Revenue Retention by measuring revenue from a customer cohort at period start versus period end, including expansions, contractions, and churn.
Top quartile SaaS companies maintain NRR above 115%, indicating that expansion revenue offsets losses.
Compare your metrics against the average customer retention rate by industry quarterly. Trends matter more than absolute numbers – improving from 70% to 75% retention over twelve months demonstrates meaningful progress even if you’re still below the 83% industry leader.
Conclusion
The average customer retention rate by industry provides essential context for evaluating business performance and setting realistic improvement targets.
While benchmarks range from 55% in hospitality to 86% in commercial insurance, every business can improve retention through data-driven customer success strategies, proactive churn prediction, and segment-specific retention playbooks.
Understanding where your company stands relative to industry peers transforms retention from a vague goal into a measurable, improvable metric that drives sustainable growth.