How to Calculate SaaS Churn Rate: Step-by-Step Guide + Calculator


Quick answer
To calculate SaaS churn rate, divide the number of customers lost during a period by the total customers at the start of that period, then multiply by 100. For example: (50 customers lost ÷ 1,000 starting customers) × 100 = 5% monthly churn rate. This metric measures customer retention health and directly impacts revenue growth potential.
Calculating churn rate accurately separates thriving SaaS businesses from struggling ones.
Every subscription company loses customers, but understanding exactly how many leave—and why—determines whether a business scales profitably or burns through capital chasing replacement customers.
The difference between a 3% monthly churn rate and a 7% rate can mean the gap between sustainable growth and a slow revenue decline.
Most SaaS teams know they should track churn, yet surprisingly few calculate it correctly.
Common mistakes include using the wrong denominator, mixing time periods, or failing to distinguish between customer losses and revenue losses.
These errors create blind spots that mask retention problems until they become crisis-level issues that require emergency intervention.
This guide walks through the exact process for calculating churn rate step-by-step, explains which calculation method fits different business models, and provides a calculator to generate accurate results immediately.
Whether tracking customer churn, revenue churn, or net retention metrics, the principles remain consistent: measure precisely, interpret correctly, and act decisively.
What Is SaaS Churn Rate?
Interactive Tutorial: Calculate Churn in 3 Steps
Step 1: Gather Your Data — identify two key numbers. Customers at start: 1,000 · Customers lost: 50
Step 2: Apply the Formula — use the customer churn formula. Calculation: (50 ÷ 1,000) × 100 = 5.0%
Step 3: Interpret the Result. Your Monthly Churn: 5.0% · Retention Rate: 95% · Assessment: Good, but room for improvement
SaaS churn rate measures the percentage of customers or revenue a subscription business loses over a defined time period. Unlike traditional businesses that record one-time sales, SaaS companies depend on recurring revenue from retained customers.
This makes churn rate a fundamental health metric that forecasts long-term viability. Two primary types of churn exist, each serving distinct analytical purposes.
Customer churn (also called logo churn) tracks the number of accounts that cancel or fail to renew subscriptions. A SaaS company starting January with 1,000 customers and losing 50 by month-end experiences 5% monthly customer churn.
Revenue churn measures the monetary value lost from existing customers through cancellations, downgrades, or contractions. The same business might lose $5,000 in monthly recurring revenue (MRR) from a $100,000 base, yielding 5% revenue churn.
These metrics diverge when smaller accounts churn at higher rates than enterprise customers, or when downgrades outpace full cancellations. Understanding this distinction reveals critical business patterns.
Gross churn calculates total losses without accounting for expansion revenue from existing customers. Net churn incorporates upsells, cross-sells, and usage-based growth, which can produce negative churn when expansion exceeds losses.
A business with 5% gross revenue churn but 7% expansion from existing customers achieves -2% net revenue churn. This indicates the customer base generates more revenue over time despite some cancellations.
Understanding these distinctions matters because each metric reveals different insights. High customer churn with low revenue churn suggests small accounts are leaving while enterprise customers stay.
Low customer churn with high revenue churn signals downgrades or contraction among retained accounts. Tracking both provides a complete retention picture that single metrics miss.
Key Takeaways
- Customer churn measures accounts lost, while revenue churn tracks MRR lost
- Gross churn = total losses | Net churn = losses minus expansion revenue
- Track both metrics for a complete retention picture—each reveals different insights
- Negative churn (when expansion > losses) signals strong product-market fit
Why Calculating Churn Rate Matters
Churn rate directly determines whether a SaaS business can achieve profitable growth. Even modest differences in churn compound dramatically over time, creating vast gaps in customer lifetime value and revenue trajectories.
A company with 5% monthly churn retains only 54% of customers after 12 months, while 2% monthly churn yields 78% retention. This 24-percentage-point difference translates to massive revenue variation for businesses of any size.
Investors scrutinize churn rates during due diligence because high churn signals fundamental product-market fit problems that no amount of marketing spend can overcome.
Enterprise SaaS companies with annual churn above 10% typically face valuation discounts or fundraising challenges.
SMB-focused products tolerate higher churn (20-30% annually) due to natural customer volatility. However, crossing these thresholds raises red flags about product stickiness and customer success effectiveness.
Churn also determines customer acquisition cost (CAC) payback period and lifetime value (LTV) calculations. If CAC equals $12,000 and monthly revenue per customer is $1,000, a business with 5% monthly churn requires significantly longer to recoup acquisition costs than one with 2% churn.
This happens because fewer revenue months occur before the customer cancels. This dynamic makes churn reduction often more valuable than new customer acquisition for mature SaaS businesses.
Understanding churn patterns by cohort, segment, and time period enables targeted retention interventions.
New customers churn at higher rates than tenured accounts, creating natural retention curves that stabilize after the first 90-180 days.
Enterprise customers exhibit different churn behaviors than SMB accounts, requiring distinct retention playbooks.
Monthly tracking reveals seasonal patterns and allows teams to detect early warning signs before churn spikes become irreversible trends.
Accurate churn calculation also prevents strategic missteps. Teams that underestimate churn may commit to growth targets that require unrealistic acquisition volumes.
Those that miscalculate revenue churn versus customer churn might invest in wrong initiatives. They may focus on customer count when revenue retention drives actual business health.
Precise measurement creates the foundation for effective retention strategy. Without accurate baseline data, improvement efforts become guesswork rather than systematic optimization.
How to Calculate SaaS Churn Rate: Step-by-Step
Calculating churn rate requires following a systematic process that ensures consistency and accuracy across time periods.
The steps below apply to both customer churn and revenue churn calculations, with specific adjustments noted for each type.
Step 1: Gather Your Data
Collect three essential data points before beginning calculations. First, identify the total number of customers (or total MRR) at the beginning of the measurement period.
This baseline must reflect active, paying customers only. Exclude trial users, cancelled accounts still in grace periods, and any accounts not yet onboarded.
Second, count customers lost during the entire period (or calculate MRR lost from existing customers). Customer losses include voluntary cancellations, involuntary churn from failed payments, and customers who completed their contracts without renewing.
Revenue losses account for full cancellations plus any downgrades or contractions from accounts that remain active but reduce spending. This distinction matters because downgrades affect revenue without impacting customer count.
Third, determine the measurement timeframe—monthly, quarterly, or annually. Monthly calculations provide the most granular insights and fastest feedback loops for retention initiatives.
Quarterly measurements smooth out seasonal variation and monthly noise. Annual churn rates offer the cleanest benchmarking comparisons but delay pattern recognition.
Whichever period chosen, maintain consistency across all subsequent calculations to enable meaningful trend analysis. Avoid the common mistake of including new customers acquired during the period in the denominator.
Churn rate measures losses from the existing customer base, not from an average or ending count. Adding mid-period acquisitions artificially deflates the churn rate and masks the true retention challenge.
Step 2: Choose Your Calculation Method
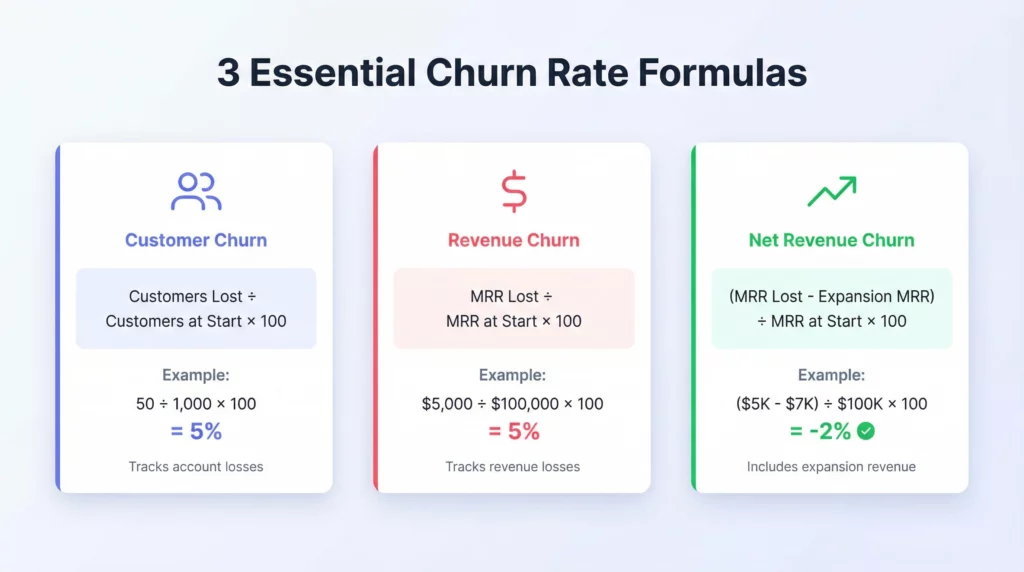
Different calculation approaches serve different strategic purposes. Customer churn rate tracks account losses and helps forecast future customer counts, making it valuable for capacity planning and customer success staffing decisions.
The formula divides customers lost by customers at period start, multiplied by 100:
Customer Churn Rate = (Customers Lost ÷ Customers at Start) × 100
Revenue churn rate measures financial impact and directly affects forecasting accuracy. This calculation divides MRR lost from existing customers by total MRR at period start:
Revenue Churn Rate = (MRR Lost ÷ MRR at Start) × 100
Net revenue churn incorporates expansion revenue from existing customers—upsells, cross-sells, and usage-based growth. When expansion exceeds losses, businesses achieve negative churn, a powerful growth multiplier:
Net Revenue Churn = ((MRR Lost – Expansion MRR) ÷ MRR at Start) × 100
Most SaaS businesses should track both customer churn and revenue churn, as they reveal different patterns. A company losing many small customers but retaining large enterprise accounts will show high customer churn but relatively low revenue churn.
The inverse—losing large customers while keeping small ones—produces low customer churn but alarming revenue churn. This threatens business viability despite healthy-looking account retention numbers.
Step 3: Apply the Formula
Execute the calculation using actual business data. Consider a B2B SaaS company that started February with 1,000 customers and lost 50 during the month.
The customer churn calculation becomes:
(50 ÷ 1,000) × 100 = 5% monthly customer churn
For revenue churn, assume the same business began February with $100,000 in MRR and lost $5,000 from existing customer cancellations and downgrades:
($5,000 ÷ $100,000) × 100 = 5% monthly revenue churn
In this scenario, customer churn and revenue churn align at 5%. This suggests churned customers represent a proportional cross-section of the customer base by revenue.
When these metrics diverge significantly, investigation reveals which customer segments drive churn. It also shows whether retention efforts should prioritize account count or revenue preservation.
Net churn calculations add expansion revenue. If the same business generated $7,000 in expansion MRR from existing customers through upsells and increased usage:
(($5,000 – $7,000) ÷ $100,000) × 100 = -2% net revenue churn
This negative 2% churn rate indicates the existing customer base grew revenue by 2% even after accounting for all losses. It’s a strong indicator of product-market fit and expansion potential that attracts investor attention and enables compounding growth trajectories.
Calculate Your Churn Rate
Run your own numbers with the three formulas from this guide:
- Customer churn: (Customers Lost ÷ Customers at Start) × 100
- Revenue churn: (MRR Lost ÷ MRR at Start) × 100
- Net revenue churn: ((MRR Lost – Expansion MRR) ÷ MRR at Start) × 100
Then read your monthly customer churn result against the same assessment scale used in the examples above:
| Monthly customer churn | Assessment |
|---|---|
| Below 3% | Excellent — below the threshold of top-performing SaaS companies |
| 3–5% | Good — within an acceptable range for B2B SaaS, with room for improvement |
| 5–7% | Needs attention — churn above 5% signals retention challenges requiring immediate action |
| Above 7% | Critical — churn above 7% indicates fundamental product-market fit issues |
To annualize a monthly result, use Annual Churn = 1 – (1 – Monthly Churn)^12, as covered in Step 4 below.
Want to automate churn tracking?
ChurnDefense calculates churn automatically and alerts you to at-risk customers before they cancel.
Step 4: Calculate Monthly and Annual Churn
Monthly churn provides operational precision for tracking retention initiatives, while annual churn enables industry benchmarking and strategic planning. Converting between these timeframes requires understanding compound effects rather than simple multiplication.
A business with 5% monthly customer churn does not experience 60% annual churn (5% × 12 months). Instead, churn compounds each month, reducing the customer base progressively.
The accurate annual retention rate calculation uses:
Annual Retention Rate = (1 – Monthly Churn Rate)^12
For 5% monthly churn: (1 – 0.05)^12 = 0.54, indicating 54% annual retention or 46% annual churn. This compounding effect explains why seemingly small monthly churn rates create dramatic annual attrition.
Such attrition threatens business sustainability when left unaddressed. Businesses reporting churn metrics to investors or comparing against industry benchmarks should annualize monthly figures using this compound formula.
Direct multiplication creates false precision that overstates annual churn and misrepresents retention health. This leads to incorrect strategic decisions and misaligned expectations with stakeholders.
The Compound Effect of Churn Over Time
Starting with 1,000 customers – see how different churn rates impact retention
| Month | 2% Churn | 5% Churn | 7% Churn | Difference (2% vs 7%) |
|---|---|---|---|---|
| Start | 1,000 | 1,000 | 1,000 | +0 |
| Month 1 | 980 | 950 | 930 | +50 |
| Month 2 | 960 | 903 | 865 | +95 |
| Month 3 | 941 | 857 | 804 | +137 |
| Month 4 | 922 | 815 | 748 | +174 |
| Month 5 | 904 | 774 | 696 | +208 |
| Month 6 | 886 | 735 | 647 | +239 |
| Month 7 | 868 | 698 | 602 | +266 |
| Month 8 | 851 | 663 | 560 | +291 |
| Month 9 | 834 | 630 | 520 | +313 |
| Month 10 | 817 | 599 | 484 | +333 |
| Month 11 | 801 | 569 | 450 | +351 |
| Month 12 | 785 | 540 | 419 | +366 |
Key insight: Reducing monthly churn from 7% to 2% retains 366 more customers (36.6%) after 12 months. Small churn differences create massive retention gaps over time.
Step 5: Interpret Your Results
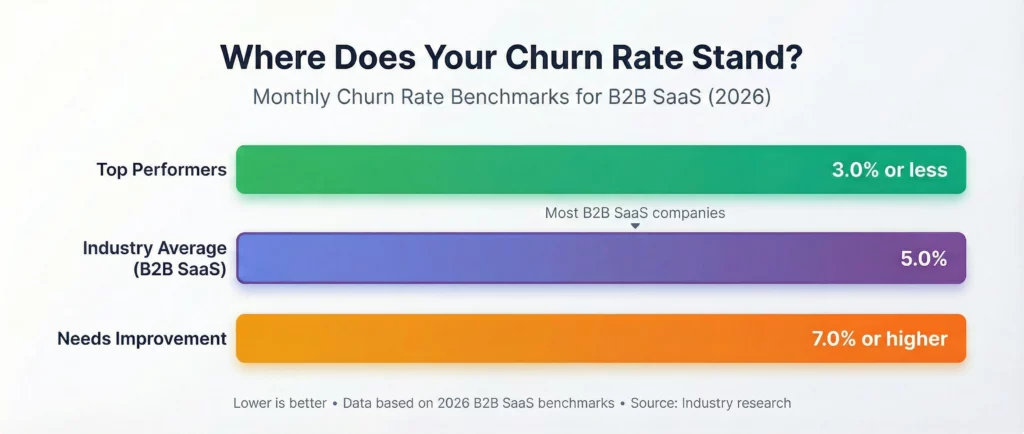
Raw churn percentages gain meaning through benchmarking and context. Enterprise B2B SaaS companies should target annual churn below 10% (approximately 0.8% monthly).
SMB-focused SaaS businesses typically accept 20-30% annual churn due to higher customer volatility. This stems from business closures and budget constraints common in smaller organizations.
Monthly churn rates between 3-5% signal retention challenges that require immediate attention. Address these through improved onboarding, customer success interventions, or product enhancements.
Monthly churn above 7% indicates fundamental product-market fit issues or severe customer success failures. These threaten business viability and require urgent executive attention.
Revenue churn matters more than customer churn for strategic decisions because it directly impacts financial sustainability. Losing 100 small customers generating $50 monthly each ($5,000 total MRR) creates less urgency than losing 10 enterprise customers contributing $1,000 monthly each ($10,000 MRR).
The first scenario loses ten times as many accounts, yet the second does twice the revenue damage—customer-count impact and revenue impact can point in opposite directions. Strategic resource allocation should prioritize revenue preservation over account count optimization.
Cohort analysis reveals whether churn rates stabilize over customer tenure. New customers typically churn at markedly higher rates than customers beyond their first year.
If churn remains elevated for tenured customers, product stickiness issues or competitive pressures require addressing.
This may involve feature development or pricing adjustments to retain long-term accounts.
Real Example: Customer Churn
Customers at start: 1,000 Customers lost: 50
Calculation: (50 ÷ 1,000) × 100 = 5.0%
This means 5% monthly churn rate, indicating 95% customer retention for the period.
Step 6: Track Over Time
Single-period churn calculations provide snapshots, but trend analysis enables pattern recognition and intervention effectiveness measurement.
Establish a consistent tracking cadence—monthly for operational management, quarterly for board reporting.
Maintain calculation methodology consistency to ensure comparable results. Methodology changes mid-stream break trend lines and prevent accurate assessment of retention improvements.
Create cohort retention curves that track customer groups by acquisition period. Customers acquired in January should show month-over-month retention percentages extending 12-24 months forward.
This visualization reveals whether retention improves for recent cohorts. Improvement indicates successful product or customer success enhancements.
If all cohorts follow similar churn trajectories regardless of improvements attempted, fundamental product changes may be necessary.
Incremental customer success tweaks won't solve structural retention problems.
Segment churn rates by customer characteristics that drive different retention patterns. Enterprise versus SMB, annual versus monthly contracts, high-usage versus low-usage customers, and different industry verticals all exhibit distinct churn behaviors.
These distinct behaviors require tailored retention strategies. Aggregate churn rates obscure these nuances and prevent targeted interventions that address root causes.
Dashboard tracking should separate voluntary churn (intentional cancellations) from involuntary churn (payment failures).
Involuntary churn often makes up a significant share of total churn and responds to dunning automation, payment method updates, and billing communication improvements.
Combining these categories prevents teams from diagnosing root causes accurately. Each type requires completely different intervention strategies and organizational ownership.
Common Mistakes When Calculating Churn
Most churn calculation errors stem from inconsistent methodology or misunderstanding which customers and time periods to include. These mistakes create measurement artifacts that mask true retention performance.
They also lead teams to draw incorrect conclusions about business health. Avoiding these pitfalls ensures accurate baseline data for improvement initiatives.
Using Ending Customer Count as Denominator
Churn rate divides losses by customers at period start, not average customers or ending count. Including new customers acquired mid-period artificially deflates the churn rate by expanding the denominator.
A business starting with 1,000 customers, losing 50, and acquiring 100 new ones should calculate churn as (50 ÷ 1,000) = 5%. The calculation should not be (50 ÷ 1,050) = 4.8%.
The latter obscures the fact that 5% of the original base churned. This masks retention problems and creates false confidence in business health.
Mixing Time Periods
Monthly and annual churn rates don't convert through simple multiplication due to compounding effects. Teams that multiply 5% monthly churn by 12 to claim 60% annual churn overstate attrition.
The accurate annual churn rate from 5% monthly churn equals 46% after accounting for month-over-month compounding.
This error becomes particularly problematic when comparing monthly operational metrics against annual industry benchmarks.
It leads to misaligned expectations and incorrect strategic decisions. Always use the compound formula for period conversions.
Ignoring Cohort Differences
Aggregate churn rates combine new customers (who churn at higher rates) with tenured customers (who typically exhibit better retention).
A business with steady customer acquisition shows artificially high churn if measured in aggregate.
This happens because new customers dominate the mix and churn at elevated rates. Cohort-based analysis isolates retention patterns by customer age.
It reveals whether retention improves over time or remains consistently problematic. This distinction determines whether onboarding improvements or fundamental product changes are needed.
Confusing Gross and Net Metrics
Reporting net revenue churn without clarifying it includes expansion revenue misleads stakeholders about actual customer losses.
A business with 8% gross revenue churn might achieve 2% net revenue churn through 6% expansion.
This creates the impression of minimal retention challenges when significant underlying churn requires addressing.
The expansion revenue masks serious retention problems that eventually catch up with the business.
Always specify whether metrics represent gross or net calculations to maintain transparency. Both numbers provide valuable but different insights into business health.
Excluding Involuntary Churn
Failed payment churn differs fundamentally from intentional cancellations but both reduce the customer base. Businesses that track only voluntary churn underestimate total attrition.
They also miss opportunities to recover customers through dunning campaigns and payment recovery processes. Separating these categories enables targeted interventions.
However, both must feed into total churn calculations for accurate business health assessment. Involuntary churn often represents quick wins through technical improvements.
Inconsistent Period Definitions
Switching between calendar months, 30-day periods, or quarters without noting the change breaks trend comparisons.
A 31-day month naturally shows higher absolute churn than a 28-day month even if rates remain constant.
Standardize on calendar months for operational tracking and exact quarterly periods for board reporting. This maintains measurement consistency and enables accurate trend analysis.
Document any methodology changes clearly when they occur. Provide restated historical figures using the new methodology to preserve trend integrity.
Avoid These Critical Errors
- Using ending customer count as denominator instead of starting count
- Multiplying monthly × 12 to get annual churn (ignores compounding)
- Mixing voluntary and involuntary churn without separating root causes
- Ignoring cohort differences—new customers churn differently than tenured ones
- Not specifying gross vs. net when reporting metrics to stakeholders
How to Track and Measure Churn Over Time
Effective churn tracking extends beyond periodic calculations to create systematic measurement infrastructure.
This infrastructure enables early intervention and trend analysis that prevent retention crises.
Building this capability requires establishing consistent data collection processes, choosing appropriate tracking frequency, and implementing visualization that reveals patterns quickly. Manual calculations suffice initially but automation becomes essential as complexity increases.
Start by creating automated dashboards that calculate churn rates across customer segments without manual data manipulation.
Modern subscription analytics platforms pull data directly from billing systems, eliminating spreadsheet errors and ensuring real-time accuracy.
Manual calculations suffice for initial setup, but automation becomes essential as customer counts grow.
Segmentation complexity increases rapidly with business maturity and product expansion.
Establish a monthly tracking cadence for operational management regardless of how churn is reported externally.
Monthly measurements provide the fastest feedback loops for retention initiatives.
They also reveal seasonal patterns that quarterly aggregation obscures. Customer success teams need monthly visibility to detect early warning signals before cohort-level churn becomes irreversible.
Implement cohort analysis that groups customers by acquisition month and tracks their retention trajectory over 12-24 months.
This visualization shows whether retention improves for recent cohorts.
Improvement indicates successful product or customer success enhancements. If all cohorts follow similar degradation curves regardless of improvements attempted, fundamental strategy changes are needed.
Cohort retention curves also reveal critical retention milestones. Many SaaS businesses see dramatic churn rate stabilization after month 6 as customers reach full adoption.
Segment churn tracking by dimensions that drive different retention behaviors.
Customer size (by MRR or seats), contract type (annual versus monthly), product tier, industry vertical, and acquisition channel all correlate with distinct churn patterns.
Enterprise customers on annual contracts typically churn at a far lower rate than SMB customers on monthly plans, and retention differs sharply by vertical—high-churn industries like hospitality behave nothing like low-churn sectors such as financial services.
One-size-fits-all retention strategies fail when customer segments behave fundamentally differently.
Track leading indicators alongside lagging churn metrics to enable proactive intervention. Product usage depth (features adopted, login frequency, session duration) typically predicts churn 30-60 days before cancellation.
Support ticket volume spikes, NPS score drops, and billing dispute patterns all signal at-risk accounts.
These accounts require immediate customer success outreach before customers make final exit decisions.
Building predictive churn scores from these signals allows teams to intervene before customers make final exit decisions.
Teams that reach out at the first warning sign consistently save more accounts than teams that react to cancellation notices.
Separate voluntary churn from involuntary churn in all tracking systems. Payment failures account for a substantial slice of total churn but respond to entirely different interventions than intentional cancellations.
Dunning campaigns, payment method updates, and billing notification improvements address involuntary churn.
Product enhancements, customer success engagement, and pricing adjustments target voluntary churn.
Combining these categories prevents root cause diagnosis. Each requires different teams, tools, and timelines to address effectively.
Measure expansion revenue from existing customers alongside churn to calculate net retention metrics. Net Revenue Retention (NRR) above 100% indicates the customer base grows revenue without new acquisition.
This creates compounding growth dynamics that dramatically improve unit economics. The strongest SaaS companies sustain NRR well above 100%, meaning existing customers compound revenue growth every year through upsells, cross-sells, and usage expansion.
This metric matters more than new logo acquisition for mature SaaS businesses.
Review churn metrics at consistent intervals with cross-functional teams. Customer success, product, sales, and executive leadership should examine monthly churn trends together.
Discuss cohort performance, segment-specific challenges, and early warning signal patterns. These reviews transform churn from a passive metric into an active management tool.
They drive prioritization and resource allocation decisions across the organization. Regular cross-functional review creates accountability and prevents siloed optimization efforts.
Tracking Best Practices
- Calculate monthly for operational precision, quarterly for board reporting
- Segment by customer size, tier, and vertical for targeted retention strategies
- Separate voluntary from involuntary churn to enable different interventions
- Monitor leading indicators (usage, NPS, support tickets) for early intervention
- Review trends cross-functionally with CS, product, sales, and leadership
Conclusion
Calculating SaaS churn rate accurately provides the foundation for retention strategy, revenue forecasting, and business health assessment.
The process requires consistent methodology—using customers at period start as the denominator, choosing appropriate calculation types for customer versus revenue churn, and tracking trends over time rather than relying on single-period snapshots.
Small measurement errors compound into major strategic missteps when teams base decisions on flawed data.
Understanding how to calculate churn rate enables businesses to benchmark performance against industry standards, identify which customer segments drive retention challenges, and measure whether retention initiatives produce meaningful improvements.
Monthly calculations create operational precision for customer success teams, while annual churn rates facilitate investor communication and competitive comparisons.
Both serve distinct purposes that comprehensive retention programs require.
The difference between 3% monthly churn and 7% monthly churn determines whether a SaaS business achieves sustainable growth or struggles perpetually to replace lost customers faster than the base erodes.
Tracking churn systematically, interpreting results correctly, and implementing targeted retention strategies based on accurate calculations separates thriving subscription businesses from those that burn resources acquiring customers who leave before generating positive lifetime value.
Mastering churn calculation transforms retention from guesswork into a measurable, improvable discipline that drives long-term success.
Ready to reduce your churn rate?
ChurnDefense helps SaaS companies identify at-risk customers, automate retention campaigns, and track churn metrics in real-time.