SaaS Churn Rate Formula: How to Calculate and Reduce Customer Churn


Quick answer
The SaaS churn rate formula is (Customers Lost During Period ÷ Customers at Start of Period) × 100. For revenue churn, swap customer counts for MRR: (MRR Lost ÷ MRR at Start) × 100. A company that starts January with 900 customers and loses 30 has (30 ÷ 900) × 100 = 3.33% monthly customer churn. Never annualize by multiplying by 12 - churn compounds, so 5% monthly churn works out to roughly 46% annual churn, not 60%.
Calculating churn rate accurately is essential for SaaS businesses to measure customer retention, forecast revenue, and identify growth opportunities.
The SaaS churn rate formula divides customers or revenue lost during a period by the total at the start, multiplied by 100 to express it as a percentage.
Understanding this metric helps companies spot retention problems early, benchmark performance against competitors, and build strategies that improve customer lifetime value.
What Is SaaS Churn Rate?
SaaS churn rate measures the percentage of customers or revenue a subscription business loses over a specific time period.
Unlike one-time purchase businesses, SaaS companies depend on recurring revenue, making churn rate a critical health metric that directly impacts valuation and growth potential.
Two primary types of churn exist: customer churn (logo churn) tracks the number of accounts lost, while revenue churn (MRR churn) measures the monetary value lost from cancellations and downgrades.
Both metrics provide different insights – high customer churn with low revenue churn suggests smaller accounts are leaving, while the inverse indicates enterprise customer retention issues.
Customer Churn vs Revenue Churn
Customer Churn Formula
(Customers Lost ÷ Customers at Start) × 100
Losing 50 of 1,000 starting customers works out to (50 ÷ 1,000) × 100 = 5% customer churn.
Revenue Churn Formula
(MRR Lost ÷ MRR at Start) × 100
Losing $5,000 from $100,000 in starting MRR works out to ($5,000 ÷ $100,000) × 100 = 5% revenue churn.
The SaaS Churn Rate Formula Explained
The basic SaaS churn rate formula for customer churn is straightforward:
Customer Churn Rate = (Customers Lost During Period ÷ Customers at Start of Period) × 100
For revenue churn, the calculation becomes:
Revenue Churn Rate = (MRR Lost During Period ÷ MRR at Start of Period) × 100
These formulas measure gross churn - the total loss without accounting for expansion revenue. Net churn incorporates upsells and expansions, which can result in negative churn when expansion revenue exceeds losses.
Step-by-Step Calculation Examples
Customer Churn Calculation
A SaaS company starts January with 900 customers and loses 30 during the month. The calculation yields:
(30 ÷ 900) × 100 = 3.33% monthly customer churn
This means 3.33% of the customer base churned in January, indicating the company retained 96.67% of customers.
Revenue Churn Calculation
The same company begins the month with $27,000 in MRR and loses $1,200 from existing customers through cancellations and downgrades. The revenue churn rate is:
($1,200 ÷ $27,000) × 100 = 4.44% monthly revenue churn
This 4.44% represents the portion of recurring revenue lost, excluding new customer acquisitions.
Net Revenue Churn Calculation
If the company loses $30,000 in revenue but gains $40,000 from existing customer expansions, starting with $500,000 MRR:
(($30,000 - $40,000) ÷ $500,000) × 100 = -2% net revenue churn
Negative churn indicates the business is growing revenue from existing customers faster than it's losing it - a powerful indicator of product-market fit and expansion potential.
Churn Rate Calculator
To run the numbers on your own book: divide customers lost by customers at the start of the period and multiply by 100 - retention rate is the mirror image (100 minus churn). Losing 25 of 1,000 customers gives (25 ÷ 1,000) × 100 = 2.5% churn, a 97.5% retention rate.
Why the SaaS Churn Rate Formula Matters
Churn rate directly impacts SaaS unit economics and long-term viability. A company with 5% monthly churn retains only 54% of customers after one year due to compounding effects, while 2% monthly churn yields 78% annual retention.
Investors scrutinize churn rates during due diligence because high churn signals product-market fit issues, weak customer success programs, or unsustainable acquisition strategies.
Companies with annual churn rates above 10% for enterprise SaaS or above 30% for SMB-focused products typically face valuation discounts.
Churn also determines payback period for customer acquisition costs (CAC). If CAC is $12,000 and monthly revenue per customer is $1,000 with 5% monthly churn, the effective payback period extends significantly compared to a 2% churn scenario because fewer months of revenue are realized before churn occurs.
Common Pitfalls in Churn Calculation
Many SaaS businesses make critical errors when applying the SaaS churn rate formula, leading to misleading metrics and poor decisions.
Including New Customers in Denominator
Churn rate should use customers at the start of the period, not average or ending counts. Including new acquisitions artificially deflates churn rates and masks retention problems.
Mixing Time Periods
Monthly and annual churn rates don't convert linearly. A 5% monthly churn rate doesn't equal 60% annual churn - the actual annual rate is approximately 46% due to compounding. See how monthly churn converts to annual churn →
Ignoring Cohort Differences
Aggregate churn rates obscure important patterns. New customers often churn at higher rates than tenured accounts, making cohort-based analysis essential for accurate trend identification.
Confusing Gross and Net Metrics
Reporting net revenue churn without clarifying it includes expansion revenue can mislead stakeholders about actual customer losses. Always specify whether churn metrics are gross or net.
Excluding Involuntary Churn
Failed payment churn (involuntary) requires different interventions than intentional cancellations (voluntary). Combining them in a single metric prevents targeted improvement efforts.
Implementation Steps for Churn Tracking
Establish a consistent measurement cadence - monthly for operational metrics and quarterly for board reporting.
Define clear criteria for what constitutes a churned customer, including grace periods, payment failures, and account pauses.
Build automated dashboards that calculate churn rates across customer segments, product tiers, and acquisition channels. Segment by ARPA (Average Revenue Per Account), industry vertical, contract length, and tenure to identify patterns that inform retention strategies.
Track both leading indicators (usage decline, support ticket spikes, NPS drops) and lagging metrics (actual churn).
Leading indicators provide 30-60 day advance warning of at-risk accounts, enabling proactive intervention before cancellation.
Implement customer health scoring that combines product usage frequency, feature adoption depth, payment history, and support interactions.
Assign risk levels to every account and trigger automated playbooks when scores decline below thresholds.
Document churn reasons through exit surveys and cancellation flow feedback. Build a taxonomy of churn drivers (pricing, missing features, competitor switches, business closure) to prioritize product roadmap and retention investments.
Measuring Success and Improving Churn
Set baseline churn rates by customer segment and establish improvement targets.
Cohort Retention Curve
Retention compounds month over month. At 5% monthly churn, a cohort of 1,000 customers erodes like this:
| Point in time | Retention | Customers remaining (of 1,000) |
|---|---|---|
| Month 6 | 73.5% | 735 |
| Month 12 | 54.0% | 540 |
Churn Reduction Revenue Simulator
To see the revenue impact of reducing churn, model your current MRR at today's churn rate against a target rate over 6, 12, and 24 months. Because retention compounds, the retained-revenue gap between the two scenarios widens every month - the worked example below shows the effect in dollar terms.
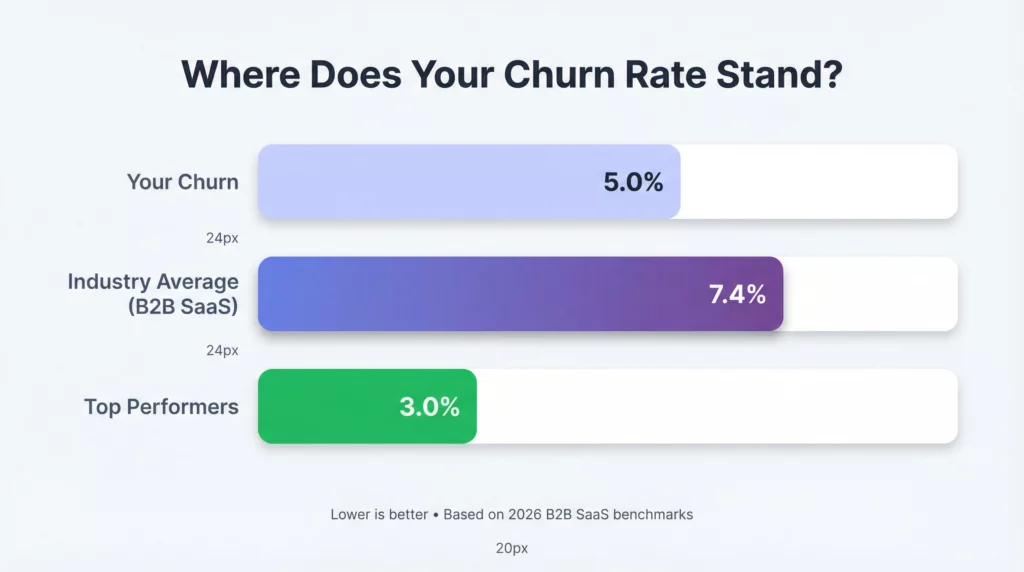
Enterprise SaaS companies should target annual churn below 10%, while SMB-focused products typically accept 20-30% annual churn due to smaller customer size and higher volatility. Compare retention and churn benchmarks by industry →
Monitor churn rate trends over time rather than absolute numbers. Improving from 7% to 5% monthly churn represents significant progress even if industry benchmarks suggest 3% as ideal. Focus on directional improvement and closing gaps systematically.
Calculate the financial impact of churn reduction.
Reducing monthly churn from 5% to 4% in a business with 1,000 customers at $100 monthly ARPA keeps an extra 10 customers - roughly $1,000 in MRR, or about $12,000 in annual recurring revenue - in the first month alone, and the benefit compounds in every subsequent month.
Experiment with retention interventions and measure impact on churn cohorts. Test save offers, pause options, downgrades, extended trials, and feature access adjustments.
Compare churn rates between control and test groups to validate effectiveness before scaling programs.
Track Net Revenue Retention (NRR) alongside churn metrics. NRR above 110% indicates expansion revenue more than offsets churn losses, creating a growth multiplier that compounds over time.
Advanced Churn Metrics
Churn Rate by Cohort
Track retention curves for customer cohorts acquired in specific months. Month-1 churn often exceeds 10%, stabilizing to 3-5% monthly by month-6 for retained customers.
Predictive Churn Scores
Implement machine learning models that combine usage patterns, billing history, support interactions, and contract details to generate probability scores for each account churning in the next 30-90 days. See which ML algorithms work best for SaaS churn prediction →
Revenue Retention by Segment
Measure churn rates separately for enterprise (>$50K ACV), mid-market ($5K-50K ACV), and SMB (<$5K ACV) segments. Each requires different retention playbooks and acceptable churn thresholds.
Involuntary vs Voluntary Split
Separate payment failures from intentional cancellations. Involuntary churn typically represents 20-40% of total churn and can be reduced through dunning automation and payment method updates.
Expansion Churn Offset
Calculate what percentage of gross churn is offset by expansion revenue. Companies with 5% gross churn and 3% expansion achieve 2% net churn, dramatically improving growth economics.
Churn Impact Calculator
Calculate the ARR impact of reducing churn by just one percentage point. At $100,000 MRR, cutting monthly churn from 5% to 4% retains an extra $1,000 of MRR in the first month alone - roughly $12,000 on an annualized basis - and the saving compounds for every month the lower rate holds.
Conclusion
The SaaS churn rate formula provides the foundation for measuring customer retention and forecasting business health.
Whether calculating customer churn by dividing lost accounts by starting accounts, or measuring revenue churn through MRR analysis, accurate churn tracking enables data-driven decisions about product development, customer success investments, and pricing strategies.
By avoiding common calculation pitfalls, segmenting churn by cohort and customer type, and tracking both gross and net metrics, SaaS companies transform churn from a lagging indicator into an actionable lever for sustainable growth.
Understanding your churn rate is only the first step - systematic measurement, root-cause analysis, and targeted retention experiments are what ultimately drive improvements in customer lifetime value and company valuation.
Stop losing revenue you already earned. Your next at-risk account is already sending signals. ChurnDefense is ready to catch them.