Annual Churn Rate from Monthly Churn: Formula, Table & Benchmarks
Quick answer
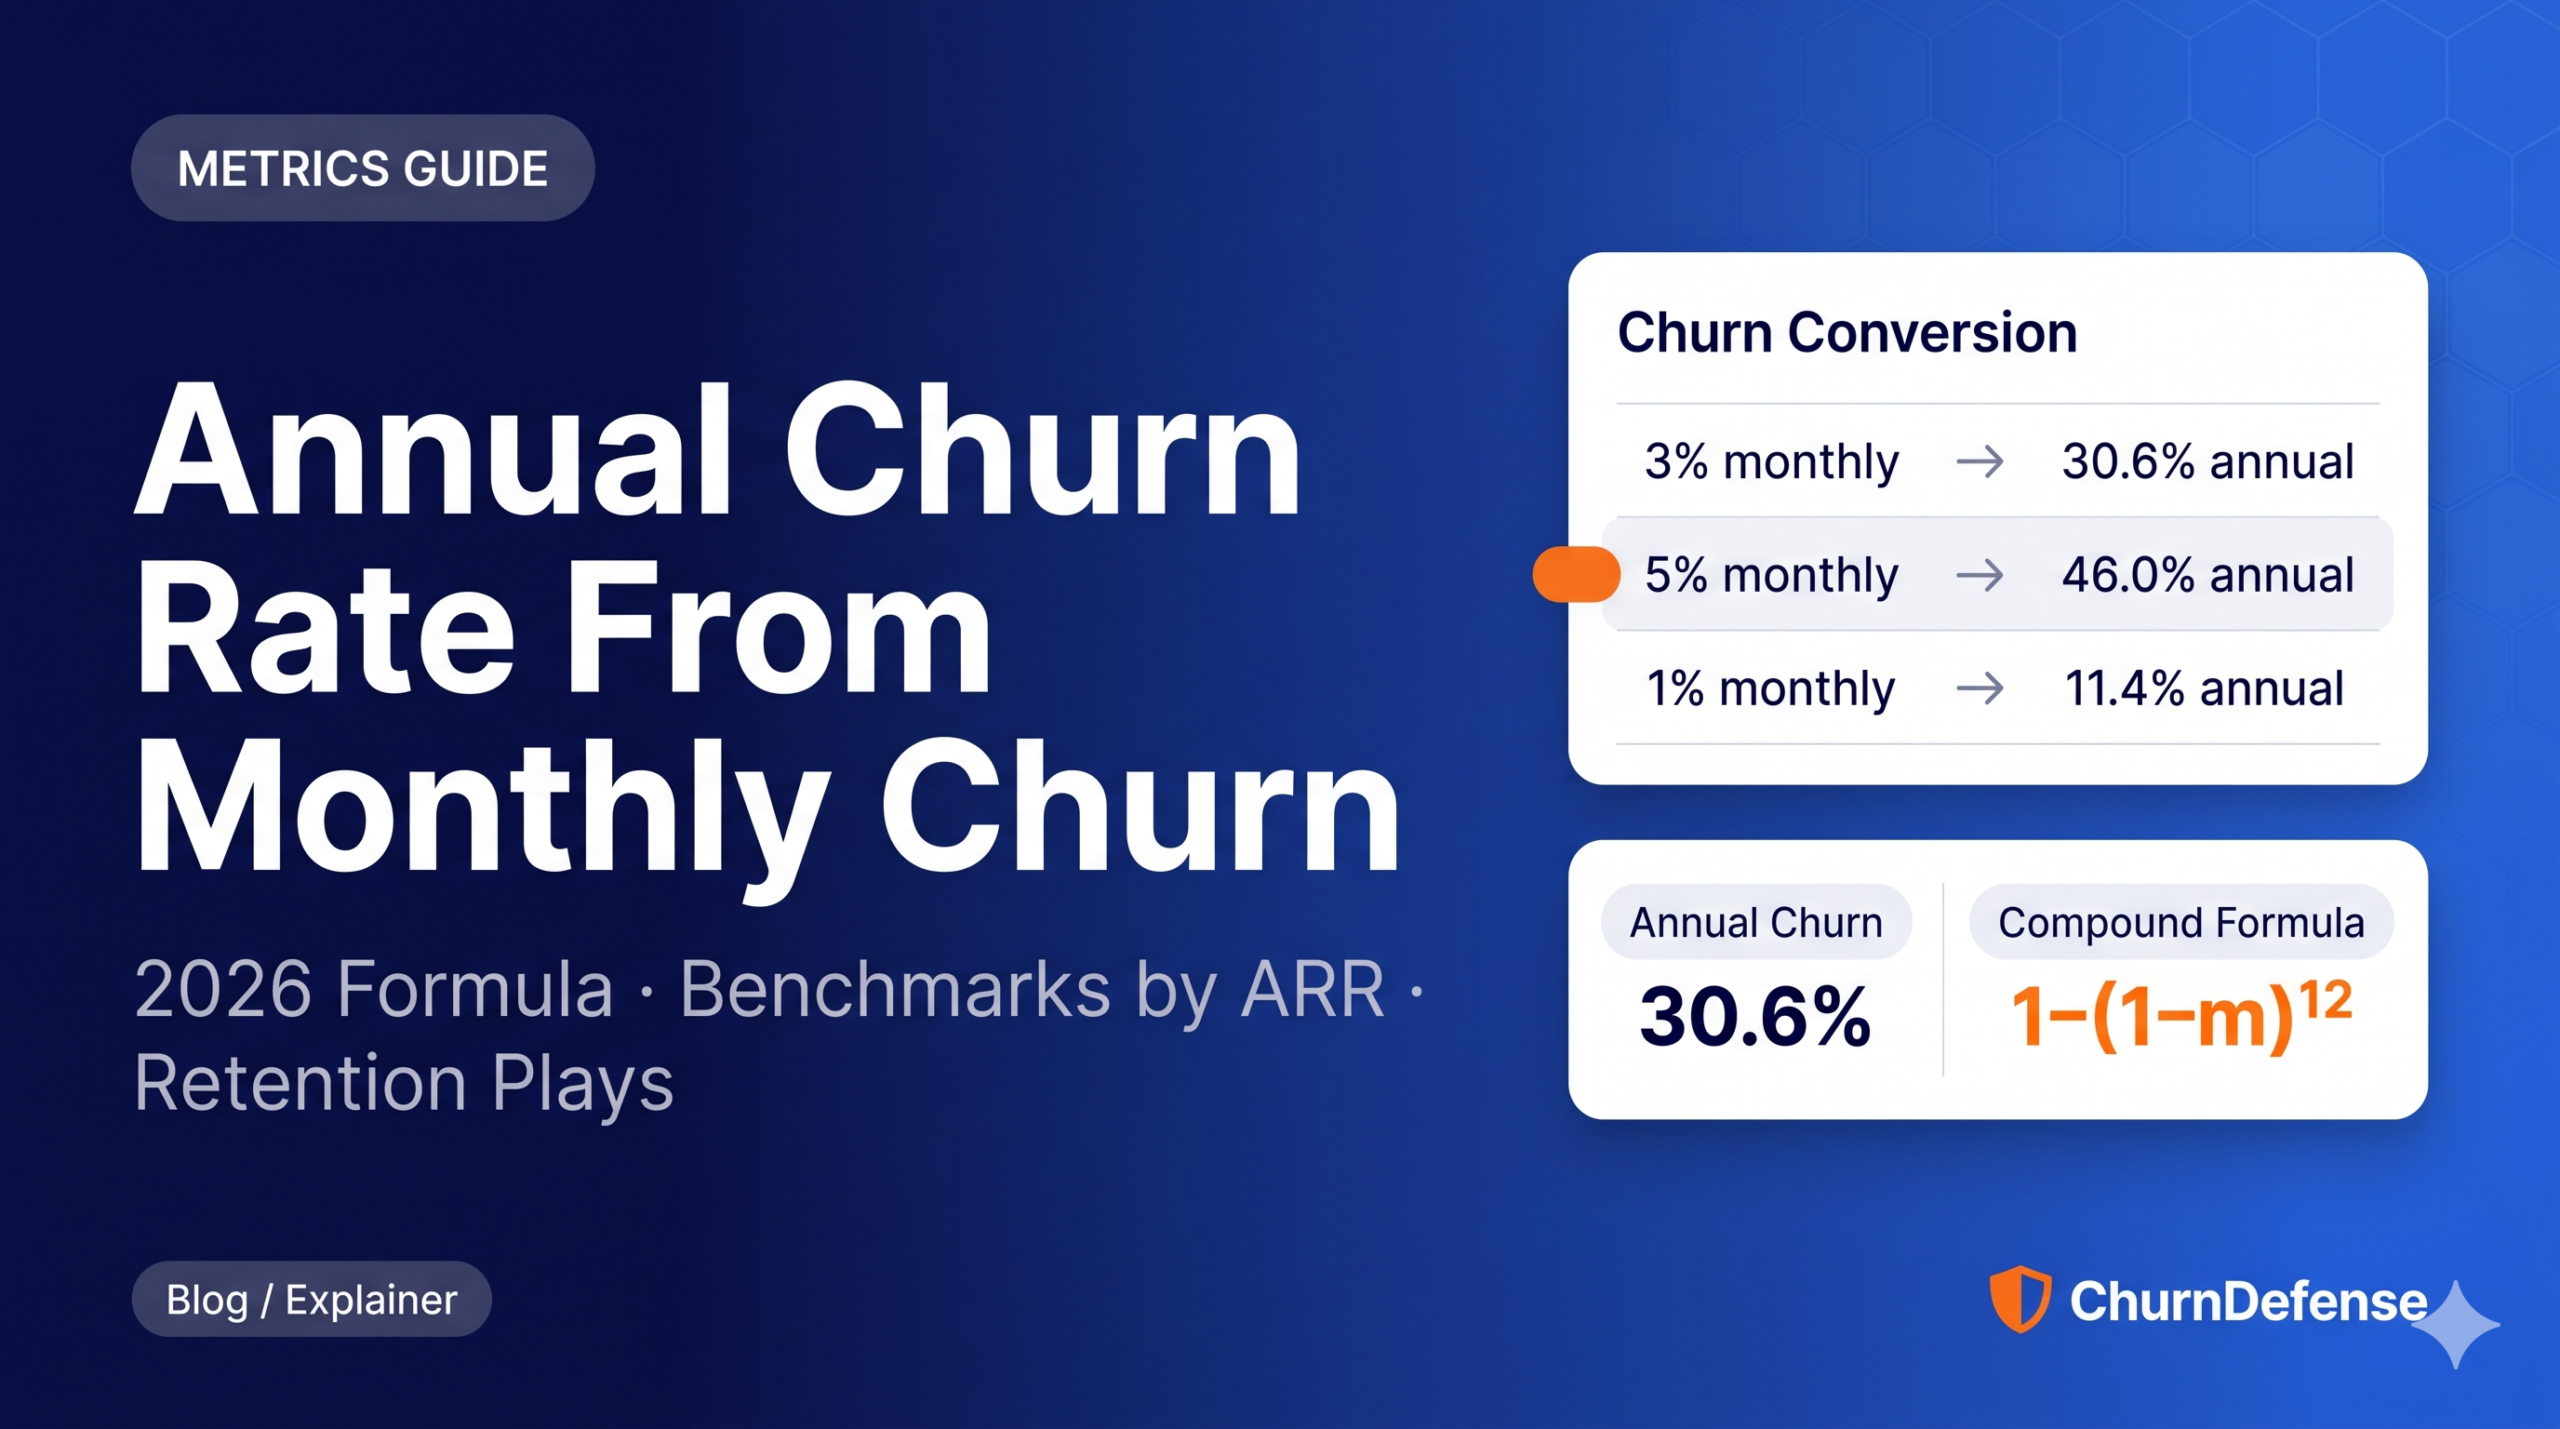
To convert monthly churn to annual churn, use the compound formula: Annual Churn = 1 − (1 − Monthly Churn)^12. Multiplying by 12 overstates annual churn due to compounding. Benchmarks vary by segment: SMB SaaS typically sees 31%–58% annual churn, mid-market 11%–21%, and enterprise 6%–11%.
Quick Answer
To convert monthly churn to annual churn, use the compound formula:
Annual Churn = 1 − (1 − Monthly Churn)¹²
Multiplying monthly churn by 12 overstates your annual churn. The correct approach accounts for compounding — each month’s retained customers form a smaller base for the next month’s calculation.
1% monthly
11.4%
annual churn
3% monthly
30.6%
annual churn
5% monthly
46.0%
annual churn
↓ Full conversion table, benchmarks by ARR segment, and a step-by-step breakdown below.
Your board asks for annual churn. Your dashboard shows monthly churn. Most teams bridge that gap by multiplying the monthly number by 12 and that’s where the math breaks down.
A SaaS company running at 3% monthly churn isn’t losing 36% of its customers per year. It’s losing 30.6%, because compounding works against you.
The difference — roughly 5 percentage points — changes how you model LTV, how you size retention budgets, and how investors read your GRR.
This guide covers three things: the correct formula to convert monthly churn to annual churn, 2026 benchmarks broken down by ARR and segment, and the five root causes most likely hiding behind your number.
By the end, you’ll know not just what your annual churn is — but what to do about it.
Free Demo
See Your True Annual Churn in One Dashboard
The Churn Metrics That Matter Before You Convert Anything
Before converting monthly churn to annual churn, it’s worth making sure you’re working with the right metric. The term “churn” can mean customer churn (logos lost), MRR churn (revenue lost), or gross revenue retention — and each feeds differently into your annual picture.
For a full breakdown of every calculation, see the SaaS churn rate formula guide.
Customer churn vs. revenue churn
Customer churn (logo churn) measures the percentage of accounts that canceled in a given period, regardless of their contract value. Revenue churn (MRR churn) measures the percentage of recurring revenue lost to cancellations and downgrades.
A company with 100 customers losing 5 small accounts may report 5% logo churn — but if those accounts represent only 1% of MRR, the revenue story is very different.
For most B2B SaaS teams reporting annual churn to a board or investor, the relevant metric is MRR churn (sometimes called gross MRR churn), because it directly maps to revenue at risk. Logo churn matters more for capacity planning and CS coverage ratios.
Gross revenue retention (GRR) vs. net revenue retention (NRR)
GRR captures what you kept from existing customers excluding any expansion — it can only move between 0% and 100%. NRR adds expansion MRR (upsells, seat adds) on top of that, so it can exceed 100%.
Annual churn and GRR are two sides of the same coin: GRR = 1 minus annual revenue churn rate. When ChartMogul’s 2024 report found that companies with NRR above 100% grew 48% year-over-year — more than double the rate of those below 100% — the underlying driver was low gross churn paired with consistent expansion.
Understanding this distinction matters because the formula in the next section calculates gross churn (what you lost). Expansion MRR is tracked separately in NRR. The two numbers work together, but should never be mixed in the same formula.
How to Convert Monthly Churn to Annual Churn (Without Messing Up the Math)
The correct way to calculate annual churn rate from monthly churn is to use the compound formula: Annual Churn = 1 − (1 − m)¹², where m is your monthly churn rate as a decimal.
This approach accounts for the fact that each month’s retained cohort is smaller than the previous one — so you’re not losing the same absolute number of customers every month, you’re losing a percentage of a shrinking base.
For a deeper walkthrough of every churn variant, the monthly vs. annual churn rate guide covers when to use each metric in practice.
The correct annual churn formula
The most common mistake is multiplying monthly churn by 12. That’s linear math applied to a compounding problem — and it consistently overstates your annual churn, sometimes by 5 to 15 percentage points depending on where your monthly rate sits.
The table below shows the difference side by side:
| Monthly Churn | Naive (× 12) | Correct (Compound) | Overstatement |
|---|---|---|---|
| 0.5% | 6.0% | 5.8% | −0.2 pp |
| 1% | 12.0% | 11.4% | −0.6 pp |
| 2% | 24.0% | 21.5% | −2.5 pp |
| 3% | 36.0% | 30.6% | −5.4 pp |
| 4% | 48.0% | 38.7% | −9.3 pp |
| 5% | 60.0% | 46.0% | −14.0 pp |
| 7% | 84.0% | 58.0% | −26.0 pp |
| 10% | 120.0% | 71.8% | −48.2 pp |
Compound formula: Annual Churn = 1 − (1 − m)¹². Naive formula: m × 12. Overstatement = naive − compound.
Worked examples for SaaS — from 1% to 5% monthly
Three scenarios that map directly to the segment benchmarks in the next section:
- 1% monthly churn → 11.4% annual. Typical for Enterprise SaaS with multi-year contracts. Each percentage point reduction in monthly churn at this level has outsized LTV impact because the base is large and the compounding effect is long.
- 3% monthly churn → 30.6% annual. Common in SMB-focused products at $1M–$5M ARR. Losing nearly a third of your customer base every year makes it nearly impossible to grow net ARR without aggressive new logo acquisition.
- 5% monthly churn → 46.0% annual. At this rate, you’re replacing almost half your customer base each year. Acquisition costs consume most of your growth budget, and NRR improvement becomes structurally very difficult.
You can also reverse the formula to find the monthly equivalent of a known annual rate. If an investor asks whether your 20% annual churn is acceptable, that translates to approximately 1.85% monthly — a very different conversation depending on your segment.
Use our SaaS churn calculator to run these conversions instantly.
What about non-constant monthly churn?
The compound formula assumes your monthly churn rate is stable across all 12 months — which is rarely true in practice.
Seasonal pricing changes, annual contract renewals concentrated in Q1, or a product incident in month 6 all create spikes that distort a straight compounding calculation.
When monthly churn varies significantly, two approaches work better:
- Cohort-based calculation: track each month’s starting cohort separately and calculate what percentage of each survived 12 months. Average the survival rates across cohorts for a more accurate annual picture.
- Weighted average monthly churn: take the MRR-weighted average of your monthly churn rates over the trailing 12 months, then apply the compound formula to that weighted figure.
For most teams operating between $500K and $50M ARR, the compound formula with a trailing 12-month average monthly rate is accurate enough for board reporting. Reserve cohort-level precision for investor diligence or post-acquisition modeling.
Where Your Annual Churn Should Land (SaaS Benchmarks by Segment & ARR)
For B2B SaaS, a healthy annual churn rate depends almost entirely on your segment and average contract value — there is no single “good” number.
A 20% annual churn rate is a crisis for an Enterprise product and a reasonable starting point for a high-velocity SMB tool still tightening its ICP.
The benchmarks below draw from SaaS Capital, KeyBanc, Jumpstart Partners, and Vitally’s 2024–2025 reports. For a broader view across industries, see the full SaaS churn rate benchmarks guide.
SMB SaaS — low ACV, $500K–$5M ARR
SMB-focused products typically see 3%–7% monthly churn, which compounds to 31%–58% annual churn using the correct formula. At the lower end of that range (3% monthly / ~31% annual), growth is still possible with strong acquisition.
Above 5% monthly (~46% annual), the math on net ARR growth breaks down for most teams — you’re spending more to replace lost revenue than to expand it.
Mid-Market SaaS — $5M–$20M ARR
As ACV rises and sales cycles lengthen, churn tends to fall. KeyBanc’s 2025 data shows a median of around 1%–2% monthly churn in this segment, translating to 11%–21% annual churn.
Teams above 2% monthly at this ARR band should treat it as a signal to audit ICP fit and onboarding depth — Mid-Market accounts have enough complexity that Poor Fit and Low Product Engagement account for a disproportionate share of losses.
Enterprise SaaS — $20M–$50M ARR and up
Enterprise SaaS with high ACV and multi-year contracts typically operates at 0.5%–1% monthly churn — 6%–11% annual churn by the compound formula.
SaaS Capital’s 2025 benchmarks place the leading target below 8% annual for this segment. Above 10% annual (~0.9% monthly), enterprise teams should investigate Champion Departure and contract renewal processes before assuming a product problem.
The ranges above reflect B2B SaaS medians across ARR bands. For a broader view broken down by industry vertical — including SaaS, fintech, healthcare, and e-commerce — the SaaS churn benchmarks by industry page pulls from the latest 2025–2026 data sets.
| Segment / ARR | Monthly Churn | Annual Churn (compound) | Status |
|---|---|---|---|
| SMB $500K–$5M ARR | ≤ 3% | ≤ 31% | ✓ OK |
| 3%–5% | 31%–46% | ⚠ Alert | |
| > 5% | > 46% | ✕ Critical | |
| Mid-Market $5M–$20M ARR | ≤ 1% | ≤ 11% | ✓ OK |
| 1%–2% | 11%–21% | ⚠ Alert | |
| > 2% | > 21% | ✕ Critical | |
| Enterprise $20M–$50M ARR+ | ≤ 0.5% | ≤ 6% | ✓ OK |
| 0.5%–1% | 6%–11% | ⚠ Alert | |
| > 1% | > 11% | ✕ Critical |
Sources: SaaS Capital 2025, KeyBanc 2025, Jumpstart Partners, Vitally SaaS Benchmarks 2024–2025. Annual churn calculated using compound formula: 1 − (1 − m)¹².
Self-Assessment
How bad is your annual churn, really?
Answer 5 questions and get your dominant root cause + recommended play.
1. What is your primary customer segment?
SMB (ACV below $10K) Mid-Market (ACV $10K–$50K) Enterprise (ACV above $50K)
2. What is your average monthly churn over the last 12 months?
Below 1% 1%–3% Above 3%
3. When does most of your churn happen?
In the first 90 days after sign-up Around renewal (6–12 months) Spread evenly — no clear pattern
4. Do you know what share of your churn comes from failed payments?
Yes — it’s below 20% of total churn Yes — it’s above 20% of total churn No — I don’t track this separately
5. What reason do churned customers most often give?
“It doesn’t fit our workflow / we don’t use it enough” “Too expensive / budget was cut” “Our contact left / team changed” We don’t collect exit feedback
Get a Retention Playbook Review →
Free · 30 min
Get a Retention Playbook Review
From Annual Churn to NRR, LTV, and CAC Payback
Annual churn is not just an operational metric — it’s a valuation input.
The same monthly churn rate that feels manageable on a CS dashboard can quietly compress your revenue multiples, extend CAC payback periods, and push NRR below the 100% threshold that separates growing SaaS companies from ones that are effectively running in place.
How annual churn shapes customer lifetime value (LTV)
Customer lifetime, in months, is calculated as 1 ÷ monthly churn rate. At 3% monthly churn, the average customer stays for roughly 33 months. Drop that to 2% monthly and lifetime extends to 50 months — a 52% increase in tenure from a single percentage point of improvement.
That difference compounds directly into LTV: if your ARPA is $500/month, reducing monthly churn from 3% to 2% takes average LTV from ~$16,500 to ~$25,000 per account.
The practical implication for retention teams: a structured save-offer program or payment recovery process that prevents even 15–20% of cancellations doesn’t just retain MRR this quarter — it reshapes the lifetime curve of every account it saves.
The link between churn, GRR/NRR, and growth
GRR and NRR are where annual churn becomes a board-level conversation. GRR is directly constrained by your gross churn rate — every point of annual churn reduces GRR by the same amount.
NRR layers expansion MRR on top of that floor. According to ChartMogul’s 2024 SaaS Retention Report, companies with NRR above 100% grew 48% year-over-year — more than double the rate of those below 100%.
The math is straightforward: if your annual revenue churn is 15%, your GRR ceiling is 85%. To reach NRR of 100%, you need expansion MRR to fully offset that 15% loss — which requires a very active upsell and expansion motion.
Teams running at 8% annual churn or below have a much easier path to NRR above 110%, which High Alpha and OpenView’s 2025 benchmarks identify as the median for leading B2B SaaS.
Why reducing churn often beats spending more on CAC
Some industry analyses suggest that acquiring a new customer costs significantly more than retaining an existing one, and that improvements in retention can have a substantial impact on profits.
Those numbers are frequently cited, but rarely applied to concrete SaaS scenarios.
Here’s what it looks like in practice: a company at 3% monthly churn with $1,000 ARPA and a $3,000 CAC has an LTV:CAC ratio of roughly 5.5x and a payback period of around 6 months.
Reduce monthly churn to 2% and — holding ARPA and CAC constant — LTV:CAC improves to approximately 8.3x.
That improvement doesn’t require a single new logo. It comes entirely from extending the average tenure of accounts already in the base.
For a deeper look at how retention metrics connect to growth strategy, see the customer retention strategy for SaaS guide.
LTV Impact by Monthly Churn Rate
Assuming ARPA = $500/month. Lifetime = 1 ÷ monthly churn rate.
1% / mo
$50K
100 mo avg life
2% / mo
$25K
50 mo avg life
3% / mo
$16.5K
33 mo avg life
5% / mo
$10K
20 mo avg life
Each percentage point of monthly churn reduction at 3% → 2% adds ~$8,500 in LTV per account. At 100 accounts, that’s $850K in recovered lifetime value.
The Root Causes Hiding Behind Your Annual Churn Number
Knowing your annual churn rate tells you how much you’re losing. Knowing the root cause tells you why — and only the why unlocks the right play.
After analyzing cancellation flows and exit data across SaaS B2B companies, five root causes account for the vast majority of churn events. Each one has a distinct signal profile and a distinct set of interventions.
Poor Fit — Wrong ICP
Signals: High churn concentrated in the first 60–90 days, low feature adoption across core use cases, support tickets describing workflows the product wasn’t designed for.
Poor Fit churn is the most expensive to fix because the problem starts before the customer signs. No save-offer or onboarding sequence can compensate for selling to the wrong profile.
The right play is an ICP audit: segment your churned accounts by firmographic and behavioral attributes (company size, industry, use case, sales channel) and identify which cohorts have the lowest 12-month survival rate.
Tighten acquisition targeting to reduce wrong-fit logos entering the funnel — every one you prevent saves the full CAC plus the CS cost of managing an account headed toward churn.
Low Product Engagement
Signals: Low activation rate in the first 30 days, declining core feature usage between days 30 and 90, health score deterioration without a support ticket or complaint.
This is the most common root cause in SMB and PLG-adjacent products. Accounts that don’t reach their activation milestone in the first 30 days are significantly more likely to churn within 6 months — making early engagement data the most reliable leading indicator available to CS teams.
The play here is a structured health score model that triggers automated alerts and CS outreach before the account goes fully dark. For a detailed framework, see the health score model guide.
Budget Pressure
Signals: Downgrade requests, mentions of cost in renewal conversations, procurement delays, or a sudden shift from multi-seat to single-seat usage.
Budget Pressure churn is often recoverable — but only if you diagnose it before the cancellation request arrives.
The value of a pre-renewal QBR is not the relationship-building; it’s the early detection. If budget is the driver, apply the save-offer hierarchy in this order: pause first, downgrade second, discount last.
A discount should be a maximum of 20% for one billing cycle, offered no more than once per account per 12-month period. Offering a discount before exhausting pause and downgrade options trains customers to cancel in order to negotiate — which increases voluntary churn long-term.
Champion Departure
Signals: Primary contact goes dark, new POC introduced late in the contract cycle, significant drop in decision-maker logins 30+ days before renewal.
Champion Departure is a silent killer in Mid-Market and Enterprise accounts because it rarely shows up in product usage data — the platform may still be active, but the internal advocate who pushed for the renewal is gone.
The play is executive multi-threading: before a champion leaves, ensure at least two other stakeholders in the account have direct product exposure and understand the ROI.
Once the champion is already gone, trigger an immediate executive outreach play to establish a new internal sponsor before the renewal window opens.
Involuntary Churn — Failed Payments
Signals: Decline codes on renewal charges, aging invoices, failed retry attempts, no response to dunning emails.
Involuntary churn from failed payments accounts for 20%–40% of total churn in many SaaS B2B bases — and it is almost entirely recoverable.
Standard dunning recovers 20%–50% of failed payments; smart retry logic with multi-channel outreach (email, SMS, in-app) can recover significantly more.
The key operational guardrail: run payment recovery as a parallel workstream to voluntary churn prevention, not as an afterthought.
Every failed payment that churns silently inflates your annual churn rate with a loss that had nothing to do with product value or customer fit.
The 5 Root Causes of SaaS Churn — Quick Reference
1
Poor Fit / Wrong ICP
Early churn, low adoption. Play: ICP audit + tighten acquisition targeting.
2
Low Product Engagement
No activation in 30 days, declining usage. Play: health score alerts + CS outreach before day 45.
3
Budget Pressure
Downgrade requests, cost mentions. Play: pre-renewal QBR → pause → downgrade → discount (max 20%, 1 cycle).
4
Champion Departure
Contact goes dark, new POC late in cycle. Play: executive multi-threading + new sponsor outreach.
5
Involuntary — Failed Payment
Decline codes, aging invoices. Play: smart retries + multi-channel dunning + card updater. 20–40% of total churn, almost fully recoverable.
Save-Offer and Retention Plays Tied to Your Churn Thresholds
Knowing your annual churn rate and its root cause is only useful if it triggers a specific action.
The plays below are anchored to the thresholds from the benchmark table — if your numbers put you in Alert or Critical territory, this is where you start. For a full deep-dive on cancellation flow design, see the save-offer frameworks guide.
Guardrails for save-offers — pause, downgrade, discount
A save-offer presented too early or too generously teaches customers to cancel strategically. The hierarchy exists to protect margin while still recovering MRR at risk.
Apply offers in this order, and only after diagnosing the root cause:
- Pause — offer a 1–2 month account pause before considering any pricing change. Works best for Budget Pressure and seasonal businesses. Costs you nothing and keeps the account alive.
- Downgrade — move the account to a lower tier that still fits their current usage. Retains the relationship and the data, with a lower MRR footprint.
- Discount — last resort only. Maximum 20% off for one billing cycle. Never offered more than once per account per 12-month period. Offering a deeper or recurring discount trains the customer to cancel every year to renegotiate.
A well-structured save-offer program that follows this hierarchy can recover 20%–30% of voluntary cancellation attempts — which at 3% monthly churn on a $2M ARR base translates to roughly $12K–$18K MRR saved per month, or $144K–$216K annually.
Fixing involuntary churn — failed payment recovery
Involuntary churn is the highest-ROI retention lever most SaaS teams underinvest in.
Standard dunning sequences recover 20%–50% of failed payments; adding smart retry logic — which tests different retry windows based on decline code patterns — can push recovery rates significantly higher.
The minimum operational setup for payment recovery:
- Retry logic: at least 3–4 retry attempts over 7–14 days, timed to avoid weekend and end-of-month billing spikes
- Multi-channel dunning: email on day 1, in-app banner on day 3, SMS or direct CS outreach by day 7 for high-ARPA accounts
- Card updater: automatic card updates from the payment network catch expired cards before they fail — preventing the failure entirely rather than recovering from it
- Segmentation by ARPA: high-value accounts warrant direct CS intervention; low-ARPA accounts should be handled entirely by automated sequences
Every failed payment you recover reduces your annual churn rate without touching product, pricing, or ICP.
Onboarding and activation plays to prevent early churn
Early churn — accounts canceling before day 90 — almost always traces back to a failure to reach the activation milestone, not to a product defect.
The activation milestone is the specific combination of actions that correlates with long-term retention: the moment a customer has extracted enough value that switching costs outweigh the friction of canceling.
Three plays that reduce early-lifecycle churn:
- Define your activation event: identify the 1–2 product actions that best predict 6-month retention in your cohort data. Build your entire onboarding sequence around driving new accounts to those actions within 14–30 days.
- 30/60/90-day health score checkpoints: flag accounts that haven’t hit activation milestones by day 30 for an automated nudge sequence; escalate to CS for any account still below threshold by day 60.
- Exit survey at cancellation: require a root cause selection before confirming any cancellation. Five categories maximum. This data feeds directly into your root cause split and makes every future benchmark comparison meaningful.
For a complete activation sequence framework, the first-week activation checklist covers the tactical setup step by step.
See It In Action
Turn Your Churn Math Into a Retention Plan
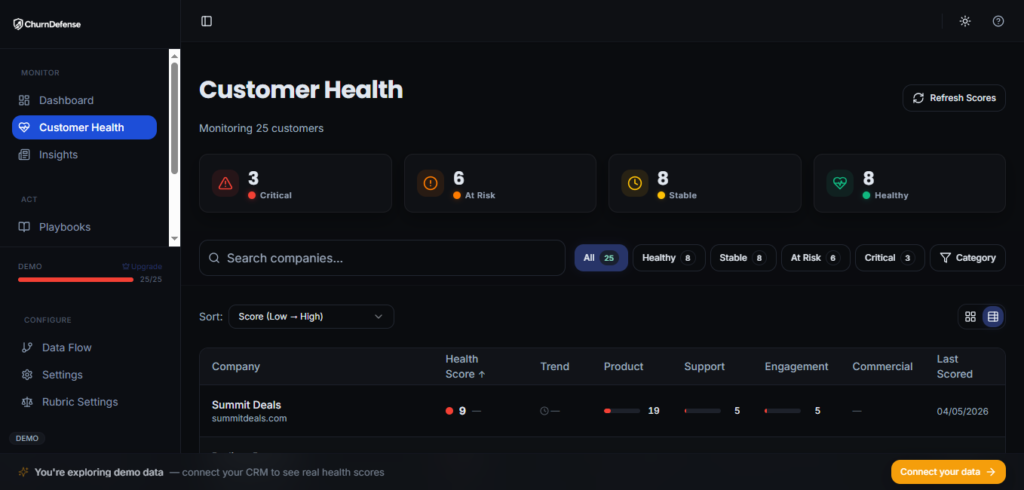
Operationalizing This in Your Retention Dashboard
A number without a workflow is just a report. The goal of tracking annual churn rate from monthly churn is to create a closed loop: measure accurately, compare against benchmarks, diagnose root cause, trigger a play, and measure the result.
That loop only works if the right metrics are visible to the right people at the right cadence.
The minimum metrics your retention dashboard needs
Most retention dashboards are either too sparse (monthly churn only) or too cluttered (every metric the billing tool exports). The minimum viable set for a B2B SaaS team operating between $500K and $50M ARR:
- Monthly churn rate (logo and MRR, tracked separately)
- Annual churn rate (calculated via compound formula, updated monthly)
- Gross Revenue Retention (GRR) — trailing 12 months
- Net Revenue Retention (NRR) — trailing 12 months
- Voluntary vs. involuntary churn split — percentage and absolute MRR
- ARPA by cohort — to identify whether churn is concentrated in high- or low-value accounts
- Activation rate at 30/60/90 days — leading indicator for future churn
Teams using a structured retention dashboard — like the one inside ChurnDefense — reduce time-to-insight significantly, because the annual churn calculation, root cause split, and benchmark comparison happen automatically rather than requiring a manual spreadsheet rebuild each month.
Building monthly-to-annual churn into your existing stack
If you’re not yet using a dedicated retention platform, the compound formula can be embedded directly into your BI tool or spreadsheet:
Annual Churn = 1 − (1 − [Monthly Churn Rate])^12
Segment this calculation by ARR band (e.g., accounts below $5K ACV vs. above $5K ACV) from the start — aggregate annual churn masks the divergence between segments that almost always exists.
A company averaging 2.5% monthly churn may have Enterprise accounts at 0.8% and SMB accounts at 4.2%, requiring completely different plays. You can also use the SaaS churn calculator to run segmented conversions without building a custom model.
Connecting dashboards, health scores, and playbooks
A dashboard that shows a red annual churn number but doesn’t connect to a triggered play is a reporting tool, not a retention tool.
The missing link is the health score: a composite signal — built from product usage, billing status, support activity, and engagement data — that predicts churn risk at the account level before the cancellation request arrives.
The operational sequence should be:
- Annual churn dashboard flags segment above threshold
- Cohort drill-down identifies which accounts are at risk
- Health score confirms risk level per account
- Play is triggered automatically (nudge, CS alert, save-offer) based on root cause classification
- Outcome is logged and feeds back into root cause split accuracy
Without step 4 and 5, the dashboard measures the problem but doesn’t reduce it.
Conclusion
Calculating the annual churn rate from monthly churn correctly — using the compound formula rather than multiplying by 12 — is the starting point, not the destination.
Once you have the right number, the work is to compare it against segment benchmarks, trace it back to one of the five root causes, and map it to a specific play.
A 3% monthly churn rate at an SMB-focused product tells a very different story than the same rate at an Enterprise product — and both require different interventions.
The teams that close the gap between measuring annual churn and acting on it are the ones that consistently hit NRR above 100% and compound growth faster than their acquisition spend.
Ready to Act on Your Numbers
See Your Annual Churn, Root Causes, and Retention Plays in One Dashboard
Get a demo of ChurnDefense and walk away with a benchmark comparison for your segment and 2–3 prioritized plays.