Machine Learning Algorithms For Churn Prediction: 5 Ranked for SaaS
Quick answer
The best ML algorithm for SaaS churn prediction depends on your data volume and team capacity — not on which model has the highest ceiling accuracy. XGBoost and LightGBM lead for mid-market and enterprise teams (65–75% accuracy). Logistic Regression is the right starting point for companies under 500 accounts. Survival Analysis adds timing precision for annual contract renewals.
⏱ 8 min read Audience: CS Leaders, VP CS, SaaS Founders Covers: SMB · Mid-Market · Enterprise
CS teams almost always know they have at-risk accounts. The problem is they find out when the cancellation email lands. At that point, 70–80% of the churn decision has already been made — and the intervention window is closed.
Most content about machine learning and churn prediction was written for data scientists. You get algorithm names, accuracy scores, and Python snippets. None of it explains what a CSM is supposed to do with a risk score on a Monday morning.
This guide breaks down the 5 machine learning algorithms for churn prediction that actually work for SaaS teams — what each one does, when to use it based on your data maturity, and how to connect each prediction to a CS intervention.
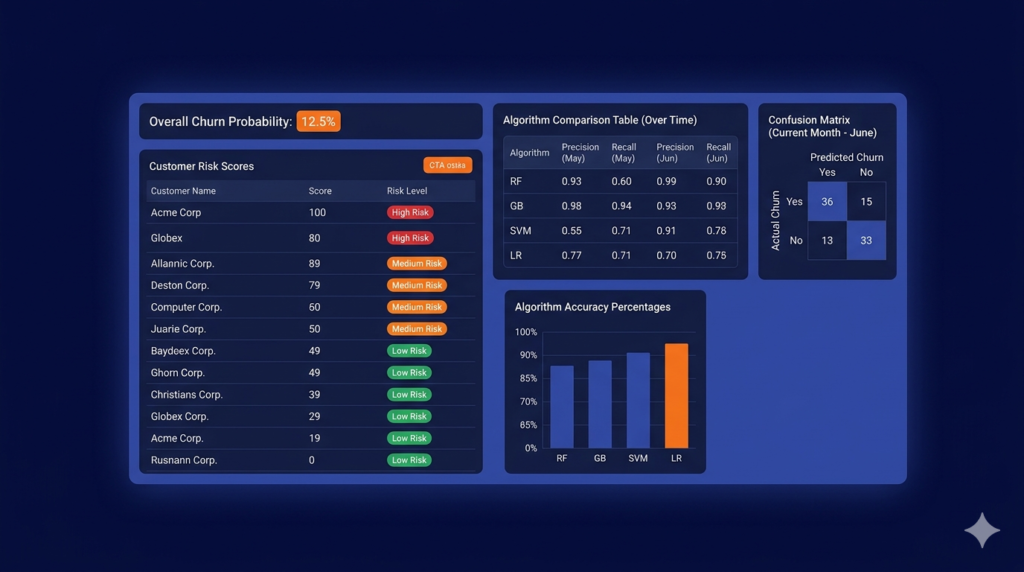
XGBoost reaches 65–75% accuracy on structured SaaS data (Kumo AI/SAP SALT benchmark).
AI can prevent up to 71% of churn when paired with human CS workflows (Lucid.now, 2026). A 5% improvement in retention drives 25–95% profit growth (Bain & Company). The models work. The question is which one is right for your stage — and what you do after the score arrives.
If you have more than 100 active customers, ML is already within reach — without a data science team.
See how ChurnDefense turns ML signals into CS plays →
Why CS Teams — Not Data Scientists — Should Own Churn Prediction
Machine learning predicts churn by analyzing behavioral signals: login frequency, feature adoption, billing health, and support ticket volume. It assigns each account a risk score before a cancellation ever happens.
The model learns from historical churn patterns and applies them to active accounts continuously.
Before building a prediction model, you need a reliable baseline to measure against. Here’s how to calculate your churn rate →
The gap between a churn score and a retention action
A churn prediction model outputs a number. That number alone does not tell a CSM what to do next. A risk probability of 0.78 is only actionable if it comes with context: why is this account flagged, and which play matches that root cause?
The difference between a useful prediction and a dashboard decoration is the bridge between score and action. When a model flags Budget Pressure, the right play is a pause offer — not a re-onboarding sequence.
When it flags Low Product Engagement, the play is a guided activation session — not a discount. Generic scores without root cause labels leave CS teams either guessing or defaulting to the wrong intervention, which can accelerate churn rather than prevent it.
What ML actually does — in plain language
ML finds patterns in historical data from accounts that already churned and learns to recognize those same patterns in active accounts. Think of it as a senior CSM who has seen several hundred cancellations and has memorized every warning sign that preceded each one.
The model doesn’t predict the future — it estimates probability based on accumulated evidence. The quality of those estimates depends entirely on the quality of the data you feed it.
A model trained on incomplete product usage data will miss the signals that matter most. Starting with clean, connected data sources is more valuable than starting with a sophisticated algorithm.
The 5 data sources SaaS teams already have
Most SaaS companies between $500K and $50M ARR have more than enough data to build a meaningful churn model. The challenge is rarely data collection — it’s data connection.
- CRM: interaction history, days since last contact, champion change signals, open opportunity stage
- Product analytics: login frequency, feature adoption rate, time-in-app per session, activation milestone completion
- Billing: payment failure events, downgrade history, plan change requests, card expiry signals
- Support: ticket volume per account, average resolution time, sentiment score, escalation frequency
- Success: NPS/CSAT scores, QBR cadence, manual health score inputs, executive engagement level
Interactive Checklist
Data Readiness Check
0 of 5 completed
Before choosing an ML algorithm, verify which data sources you already have connected:
-
CRM data connected
Interaction log + days since last CSM contact
-
Product analytics tracking
Login frequency + feature adoption rate (last 30/60/90 days)
-
Billing health signals
Payment failure events + downgrade history
-
Support ticket data
Ticket volume per account + average resolution time
-
Labeled churn history
NPS/CSAT + at least 6 months of labeled churn events
The 5 ML Algorithms Ranked for SaaS Churn Prediction
The best machine learning algorithm for churn prediction isn’t the most sophisticated one, it’s the one that matches your data volume, team capacity, and business context.
Stacking a deep learning model on a 300-account dataset doesn’t improve accuracy; it destroys it. Here’s how the top 5 rank for SaaS teams, from the simplest baseline to the most powerful production-grade option.
1. Logistic Regression — The Fastest Baseline
Logistic regression classifies each account as “likely to churn” or “not likely to churn” based on a weighted combination of input variables. Each variable gets a coefficient that you can read and explain — which makes this the most transparent model available.
When to use it: datasets under 500 accounts, teams without a dedicated data scientist, or any situation where explainability to stakeholders is non-negotiable. It’s also the right first model when you’re still validating which signals actually predict churn in your specific product.
- Typical accuracy: 55–65% (Kumo AI benchmark)
- Minimum data: ~200 labeled churn events
- Main advantage: every variable has a readable coefficient — a CFO or board member can follow the logic
- Main limitation: doesn’t capture complex interactions between variables (e.g., the compounding effect of low engagement combined with a recent support escalation)
2. Random Forest — The Reliable Workhorse
Random Forest builds hundreds of decision trees on random subsets of your data and combines their votes into a single prediction. The aggregate result is far more stable than any individual tree — and the model naturally outputs feature importance rankings, showing which signals carry the most weight.
When to use it: mid-market datasets between 500 and 2,000 accounts, teams that need to balance accuracy with interpretability, and scenarios where identifying the top predictive signals (for CSM training or product prioritization) is as valuable as the prediction itself.
- Typical accuracy: 60–68% (Kumo AI benchmark)
- Minimum data: ~500 labeled churn events
- Main advantage: feature importance output is ideal for identifying which behavioral signals to monitor across the team
- Main limitation: slow to retrain in real time — better suited for weekly or monthly scoring runs than continuous monitoring
3. XGBoost / LightGBM — The Accuracy Leader
XGBoost and LightGBM use gradient boosting: each new tree in the sequence learns specifically from the errors of the previous one.
The result is a model that progressively sharpens its predictions on the hardest-to-classify accounts — exactly the edge cases that matter most in churn prevention.
When to use it: datasets above 1,000 accounts with structured product, billing, and CRM data available. This is the standard production model for mid-market and enterprise SaaS teams with access to clean feature engineering.
- Typical accuracy: 65–75% on structured SaaS data; up to 89% with multi-table inputs (Kumo AI / SAP SALT benchmark)
- Minimum data: ~1,000 labeled churn events
- Main advantage: best performance on tabular structured data — the exact format SaaS companies generate
- Main limitation: requires feature engineering; predictions are harder to explain without SHAP values layered on top
4. Survival Analysis — When Timing Matters More Than If
Survival analysis doesn’t just predict whether an account will churn — it models when. The output isn’t a probability score but a time-to-event estimate: “this account has a 72% probability of churning within the next 90 days.”
When to use it: Enterprise SaaS with annual contracts and predictable renewal cycles. If your CSMs run QBRs and need to prioritize interventions at 90/60/30 days before renewal, survival analysis gives you the scheduling layer that standard classifiers can’t.
- Typical accuracy: comparable to XGBoost, but with time-horizon output instead of binary classification
- Minimum data: ~500 renewal events with timestamps
- Main advantage: perfect for proactive QBR scheduling — you know not just who is at risk but when the window closes
- Main limitation: more complex setup; requires clean temporal data with accurate renewal dates
5. Clustering Models — Revealing Hidden At-Risk Segments
Clustering algorithms (k-means, DBSCAN) group accounts by behavioral similarity without needing labeled churn data. The model doesn’t predict churn directly — it reveals natural segments in your customer base that you didn’t know existed.
When to use it: as a complement to other models, especially in the early stages of building a prediction program. Clustering is also valuable when your labeled churn dataset is too small for a classifier but you still need to identify which accounts deserve attention.
- Accuracy metric: silhouette score (not directly comparable to classifiers)
- Minimum data: ~300 accounts with behavioral features
- Main advantage: surfaces hidden patterns — such as a specific onboarding cohort or pricing tier that clusters with historically high churn — that no one on the team had identified
- Main limitation: doesn’t predict churn directly; requires human interpretation to connect cluster characteristics to risk
| Algorithm | Typical Accuracy | Min. Accounts | Technical Effort | Best For |
|---|---|---|---|---|
| Logistic Regression | 55–65% | ~200 | Low | SMB, fast baseline, stakeholder explainability |
| Random Forest | 60–68% | ~500 | Medium | Mid-Market, feature importance analysis |
| XGBoost / LightGBM | 65–75% | ~1,000 | High | Mid-Market / Enterprise, production accuracy |
| Survival Analysis | 65–75% | ~500 renewals | High | Enterprise, annual contracts, QBR timing |
| Clustering Models | N/A* | ~300 | Medium | Segment exploration, early-stage programs |
*Clustering uses silhouette score, not prediction accuracy. Source: Kumo AI / SAP SALT benchmark, 2025.
Skip the model-building.
Teams using a structured prediction dashboard — like the one inside ChurnDefense — reduce time-to-insight from weeks to hours.
From Churn Score to CS Playbook: The Root Cause Bridge
A churn score without context is just a number. The real value of ML for CS teams comes from connecting each risk signal to its root cause — and then matching that cause to the right intervention.
A model that outputs “0.82 probability of churn” tells a CSM that something is wrong. Feature importance and SHAP values tell them what is wrong — and that distinction determines whether the next conversation saves the account or accelerates the departure.
How feature importance maps to the 5 root causes of churn
When Random Forest or XGBoost outputs a risk score, it also outputs a ranked list of the variables that drove that prediction. This is called feature importance. Each high-importance feature corresponds to a specific root cause — and that root cause determines which CS play to run next.
SHAP values take this one step further. Instead of showing which features matter most across the entire model, SHAP breaks down the prediction at the account level: “this specific account was scored Red because login frequency dropped 58% in the last 30 days and the primary user changed 11 days ago.”
A CS Manager can read that output, understand it immediately, and walk into a renewal conversation prepared — without writing a single line of code.
The table below is the operational bridge that no competitor article provides: ML feature → root cause → CS intervention.
ML Signal → Root Cause → CS Intervention
| Root Cause | High-Importance ML Features | Risk Score Behavior | Recommended CS Play |
|---|---|---|---|
| Low Product Engagement | Login frequency drop, feature adoption <30%, time-in-app decline | Rises steadily over 30 days | CSM check-in + guided activation session targeting unused high-value features |
| Budget Pressure | Payment failures, downgrade history, plan change requests, billing email opens | Rises 60–90 days before renewal | Hierarchy: pause offer → downgrade → 1-cycle discount (max 20%). Diagnose before offering. |
| Champion Departure | Primary user change, seat activity drop, new login from unknown email domain | Spikes immediately after user change event | Executive outreach within 72h + new champion onboarding sequence |
| Poor Fit / Wrong ICP | High support ticket volume in first 90 days, time-to-value failure, low feature breadth adoption | Elevated chronically since onboarding | CS escalation + ICP re-evaluation. Consider a structured offboarding rather than a save offer. |
| Involuntary / Failed Payment | Payment failure events, card expiry signal, billing email bounce rate | Triggers immediately on failure event | Automated dunning sequence + proactive billing outreach within 48h. Most predictable churn type. |
Each root cause in the table above maps to a distinct retention play. For a full breakdown of intervention frameworks by churn type, see the churn reduction strategies guide →
The save-offer hierarchy — triggered by ML, executed by humans
ML prediction doesn’t replace the CSM — it defines which tool the CSM should reach for before the conversation starts. The model tells you the root cause.
The root cause determines the play. Without that sequence, teams default to discounting every at-risk account, which trains customers to wait for a price drop rather than finding value in the product.
The hierarchy is non-negotiable for Budget Pressure cases: pause → downgrade → discount. A discount should never be the first offer. Maximum 20% off one billing cycle.
Never more than one save offer per account in a 12-month window. The score and the root cause determine which path to take — not the CSM’s intuition in the moment.
The Save-Offer Rule
Diagnose before you offer. ML tells you why an account is at risk — the intervention depends on the root cause, not the score alone. A 0.85 risk score driven by Low Engagement calls for an activation play, not a discount. A discount in this context signals low product confidence and can accelerate the churn it was meant to prevent.
For a complete framework on structuring save conversations by root cause, see our guide on how to reduce churn rate in SaaS →
How Much Data Do You Actually Need? A SaaS Size Reality Check
Most ML churn articles assume thousands of customers. The reality for SaaS companies between $500K and $10M ARR is very different — and the good news is that simpler models can still deliver significant lift even with limited data.
The goal at every stage isn’t the most accurate model possible; it’s the most accurate model your current data volume can support reliably.
SMB ($500K–$5M ARR) — Under 200 churn events
Small datasets break complex models. When you have fewer than 200 historical churn events, XGBoost will overfit — it will learn the noise in your training data instead of the signal. The model will look impressive on paper and fail in production.
What works at this stage: Logistic Regression with 4–5 manually selected signals (login frequency, NPS score, ticket volume, billing health, days since last CSM contact) or a rule-based health score with clear thresholds.
The realistic target is identifying 60–65% of at-risk accounts 30 days before they churn. That’s enough to make a material difference in MRR retained. If you’re still establishing your baseline metric, see how to calculate SaaS churn rate →
Mid-Market ($5M–$20M ARR) — The XGBoost sweet spot
With 500 to 2,000 active accounts and 18+ months of churn history, you have enough labeled events to train a gradient boosting model reliably. Three to five product features combined with billing signals and CRM interaction data is sufficient for the first version — no need for a complex multi-table pipeline.
The realistic target at this stage: 65–75% accuracy with a 60-day prediction lead time. That window gives CSMs enough time to run a proper intervention sequence before the renewal conversation becomes a cancellation conversation.
A 5% improvement in retention at this ARR stage translates directly to 25–95% profit growth (Bain & Company). To know whether your numbers are above or below the median for your segment, see the average customer retention rate by industry → or the full SaaS Churn Benchmarks →“
Enterprise ($20M–$50M ARR) — Multi-table models and advanced timing
At this stage, a single data source isn’t enough. Account volume and data richness support Survival Analysis or XGBoost with multi-table inputs — combining product telemetry, CRM, billing, support, and success data into a unified feature set.
Each additional source meaningfully increases prediction accuracy: Kumo AI’s benchmark shows accuracy jumping from 65–75% with single-table inputs to up to 89% when multi-table data is integrated.”
The prediction window shifts from 60 days to 90 days before each renewal date.
Gainsight’s production model at enterprise scale uses Explainable Boosting Machines (EBM) trained on survey responses, CTA engagement, and meeting frequency — a combination that mirrors the multi-source approach described here.
The target is 70%+ accuracy with lead time sufficient for a proactive QBR before the renewal cycle opens.
Recommended Model by ARR Stage
SMB
$500K–$5M ARR · under 200 churn events
Complex models overfit at this data volume. A structured health score delivers reliable lift without the ML overhead.
Recommended model
Rule-based scoring or Logistic Regression
Mid-Market
$5M–$20M ARR · 500–2,000 accounts
Enough labeled events to train a gradient boosting model reliably. Product, billing, and CRM signals combined are sufficient for v1.
Recommended model
Random Forest or XGBoost
Enterprise
$20M–$50M ARR · 1,000+ accounts
Data richness supports multi-table models with 90-day prediction windows — enough lead time for a proactive QBR before renewal opens.
Recommended model
XGBoost multi-table or Survival Analysis
Quiz: Which Churn Prediction Approach Is Right for Your Team?
Before investing in a churn model, it helps to know where you actually stand. The right algorithm isn’t the most sophisticated one available — it’s the one your data volume and team capacity can support reliably today. Answer 5 questions to get a personalized recommendation.
Self-Assessment
Which ML approach fits your team right now?
Question 1 of 5 0% complete
Ready to act on predictions?
Stop waiting for cancellation emails.
ChurnDefense surfaces ML-powered risk signals — mapped to root causes and CS plays — directly in your workflow. No data science team required.