Customer Retention Rate Formula: How to Calculate CRR in SaaS (2026)

Quick answer
The customer retention rate formula is CRR = ((E - N) / S) * 100, where S is customers at the start of the period, E is customers at the end, and N is new customers acquired during the period. The post thoroughly explains the difference between logo CRR and revenue retention (GRR) using the same logical structure but replacing accounts with MRR. It includes step-by-step worked examples, benchmarks by ARR tier, and diagnostic guidance for when CRR falls below segment medians.
Quick Answer
The customer retention rate formula is: CRR = ((E − N) ÷ S) × 100 — where E is customers at end of period, N is new customers acquired during the period, and S is customers at start. The result is the percentage of existing customers you retained. A separate formula applies for revenue retention (GRR/NRR), which counts MRR rather than accounts.
The customer retention rate formula looks simple — and it is.
What trips up most SaaS teams isn’t the math. It’s choosing the wrong variables, the wrong measurement period, or the wrong version of the metric entirely — and then making strategic decisions based on a number that doesn’t mean what they think it means.
This guide covers the standard CRR formula, the difference between logo and revenue retention, how measurement period changes your result, and what to do when your number comes back below benchmark.
Each section includes worked SaaS examples so you can apply it directly to your own data.
Some industry benchmarks suggest that fewer than half of SaaS companies track both logo and revenue retention separately — meaning many work with an incomplete picture of retention health. This guide closes that gap.
What Is the Customer Retention Rate Formula?
The customer retention rate formula measures the percentage of existing customers a SaaS company retains over a defined period, excluding any new customers acquired during that time.
It is one of the most cited metrics in SaaS finance and customer success — and one of the most frequently miscalculated.
The Standard CRR Formula
CRR=E−NS×100CRR=S**E−N×100
Where:
- S = number of customers at the start of the period
- E = number of customers at the end of the period
- N = number of new customers acquired during the period
Example: You start January with 400 customers, acquire 60 new ones during the month, and end with 420 customers.
CRR=420−60400×100=360400×100=90%CRR=400420−60×100=400360×100=90%
You retained 90% of your existing customer base during January.
What Each Variable Means — and the Most Common Mistake
The formula has three variables and one consistent mistake: teams include new customers in E without subtracting them via N — which inflates CRR and masks real churn.
The logic behind subtracting N is straightforward: new customers acquired during the period had no opportunity to churn. Including them in your retention calculation would make a company with 50% churn look healthy simply because it acquired aggressively.
CRR measures loyalty of the existing base — not growth.
Two additional definitions to lock in before calculating:
- What counts as a “customer”? Define this consistently — paid accounts only, or including trials? Seats or companies? The definition must stay fixed across periods or your trend data becomes meaningless.
- What counts as “churned”? A customer who downgrades to $0 is churned. A customer on a payment pause may or may not be, depending on your policy. Define the boundary explicitly before running the formula.
Related: What Is Customer Retention Rate — full definition, benchmarks by segment, and the difference between CRR and NRR.
FREE DEMO
Track CRR and revenue retention in one place
Book a free demo and see how ChurnDefense calculates logo and revenue retention automatically — segmented by ARPA tier, cohort, and acquisition channel.
Logo CRR vs. Revenue CRR: Two Formulas, Two Different Answers
Most SaaS teams calculate one retention number and stop there. But there are two fundamentally different customer retention rate formulas — and they can tell completely opposite stories about your business at the same time.
Understanding the difference is not optional if you are making pricing, CS staffing, or expansion decisions based on retention data.
Logo Retention Rate — Counts Accounts, Not Revenue
Logo retention rate measures the percentage of customer accounts (logos) that renew over a given period, regardless of how much each pays. It uses the standard CRR formula introduced above: ((E − N) ÷ S) × 100.
This metric is most useful when your customer base is relatively homogeneous in contract size — typically SMB SaaS with ACV below $10K.
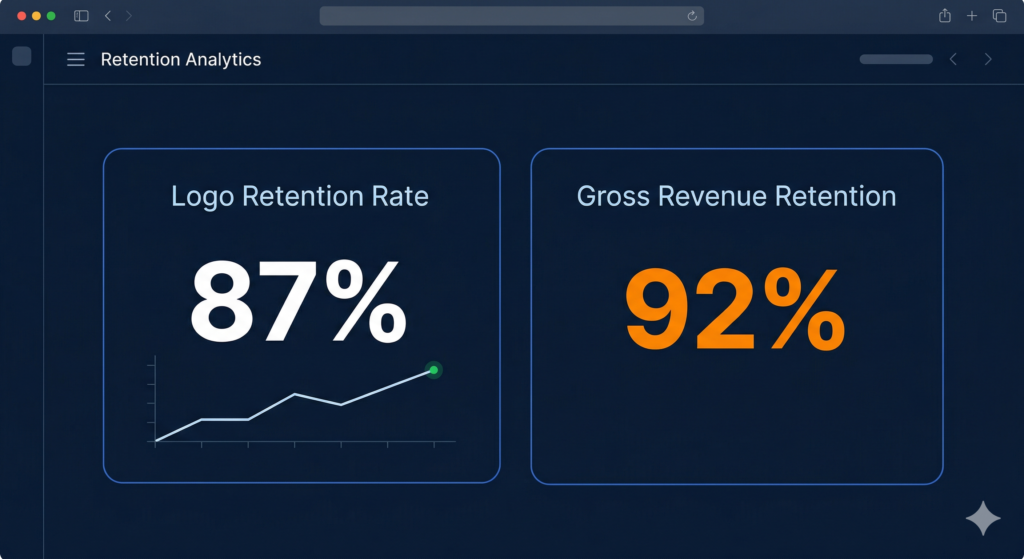
Industry benchmark data suggests median logo retention across B2B SaaS companies is around 85%, ranging from roughly 89% for companies at $1–5M ARR to 83% for those at $50–100M ARR.
When ACV exceeds $10K, logo retention becomes less informative in isolation because a single large account can represent more revenue than 50 small ones. That is when revenue retention takes over as the primary signal.
Revenue Retention Rate (GRR) — Counts MRR, Not Accounts
Gross Revenue Retention (GRR) applies the same logical structure as the logo formula — but replaces account counts with MRR values, and caps the result at 100% by excluding expansion revenue:
GRR=MRRend−MRRexpansionMRRstart×100GRR=MRRstartMRRend−MRRexpansion×100
GRR shows how much of your existing MRR you preserved before any upsells or expansions. Some industry sources report a median GRR for B2B SaaS around 90%, with top quartile companies exceeding 95%.
Enterprise-focused SaaS ($100M+ ARR) is often reported near 94% GRR, while smaller companies ($1M–$10M ARR) tend to cluster around 85%.
Why a Company Can Have 90% Logo CRR and Still Be Shrinking
This is the most important counterintuitive point in retention measurement. Consider this scenario:
- A SaaS company starts the quarter with 100 customers: 10 enterprise accounts at $5K/month each, and 90 SMB accounts at $200/month each
- 8 SMB accounts churn (logo CRR = 92%)
- 1 enterprise account also churns
Logo CRR: 91% — looks healthy. Revenue impact: the enterprise churn alone removed $5K/month vs. $1,600/month lost from the 8 SMB churns combined. GRR tells the real story.
As PipelineRoad’s 2026 data shows, a company can have 15% annual logo churn and 130% net revenue retention simultaneously — the Slack and Datadog expansion playbook.
Tracking only logo CRR in that scenario would trigger unnecessary alarm. Tracking only NRR would hide a real customer satisfaction problem.
RULE OF THUMB
Track logo CRR if your ACV is below $10K — it reflects customer satisfaction most directly. Track GRR if ACV exceeds $10K — revenue weight matters more than account count. Track both if you serve mixed segments.
Step-by-Step CRR Calculation With Real SaaS Examples
The formula is the same across scenarios — what changes is the period, the unit of measurement, and the customer definition. These three examples cover the most common calculation contexts in SaaS.
Example 1 — SMB SaaS, Monthly Period
Scenario: A PLG SaaS tool. 800 active paid accounts on March 1. Acquired 120 new paid accounts during March. 850 active paid accounts on March 31.
CRR=850−120800×100=730800×100=91.25%CRR=800850−120×100=800730×100=91.25%
Monthly CRR of 91.25%. Logo churn for the month: 8.75% — or 70 accounts lost from the original 800.
Example 2 — Mid-Market SaaS, Annual Period
Scenario: B2B workflow platform. 210 customers on January 1. Added 55 new customers across the year. 220 customers on December 31.
CRR=220−55210×100=165210×100=78.6%CRR=210220−55×100=210165×100=78.6%
Annual CRR of 78.6% — below the 83–85% median for this ARR tier. Worth investigating root causes before the next renewal cycle.
Example 3 — Cohort-Based Calculation
Cohort-based CRR tracks a specific group of customers from their acquisition month forward, rather than measuring the whole base at two points in time. It is the most accurate method because it eliminates the distortion caused by customers acquired mid-period.
Scenario: 60 customers acquired in January. By July 1 (6-month cohort check), 47 of those original 60 are still active. No new customers are added to this cohort by definition.
Cohort CRR (6-month)=4760×100=78.3%Cohort CRR (6-month)=6047×100=78.3%
Cohort analysis is the method used by most retention-mature SaaS teams because it reveals whether newer cohorts are retaining better or worse than older ones — a critical signal when evaluating the impact of onboarding changes, pricing updates, or ICP shifts.
Related: Customer Retention Strategy for SaaS — how to act on cohort data to improve retention systematically.
CRR Calculator
Enter your numbers below to calculate your Customer Retention Rate instantly.
Customers at Start (S)
Customers at End (E)
New Customers Added (N)
YOUR CUSTOMER RETENTION RATE
CRR vs. Churn Rate: The Inverse Relationship
Customer retention rate and churn rate measure the same customer base from opposite angles — one counts who stayed, the other counts who left. Understanding the relationship between them prevents the most common reporting confusion in SaaS CS teams.
The Formulas Side by Side
The churn rate formula counts the customers lost during a period as a percentage of the starting base:
Churn Rate=S−(E−N)S×100Churn Rate=S**S−(E−N)×100
The relationship with CRR is direct: CRR + Churn Rate = 100% — but only when both metrics use the same definition (logo-based counts, same period, same cohort).
If you mix revenue-based retention with account-based churn, or use different time periods, the identity breaks and you get contradictory numbers that confuse rather than inform.
When to Use Each Metric
Both metrics are valid — the choice depends on what you want to communicate and to whom:
- CRR — preferred in board decks, investor reporting, and CS team goals; emphasizes stability and loyalty
- Churn rate — preferred for operational diagnostics, support triage, and product decisions; emphasizes the size of the problem to fix
- Neither alone — executives need both; a 90% CRR sounds strong until you see that 10% churn represents $800K in lost ARR on a $8M ARR base
Why CRR Is Not Simply “100% Minus Churn”
The equation CRR = 100% − Churn Rate holds only for logo-based, same-period calculations.
The moment you move to revenue retention (GRR), this identity no longer applies because GRR excludes expansion revenue by design, while NRR can exceed 100% — something churn rate can never do.
A company with 95% GRR and 15% NRR growth simultaneously has a “churn rate” that is mathematically negative in revenue terms.
Tracking the correct formula for each business question matters more than defaulting to whichever metric is easiest to calculate.
COMMON MISTAKE
CRR = 100% − Churn Rate only when both use the same definition. Mixing revenue-based GRR with account-based churn rate produces contradictory numbers. Define your base unit — accounts or MRR — and stick with it across both formulas before comparing.
What to Do When Your CRR Is Below Benchmark
A below-benchmark CRR is a diagnostic signal, not a verdict. The right response depends on your ARR tier, your ARPA, and which of the five root causes is driving the loss.
Acting before diagnosing is the most common retention mistake — and the one most likely to result in discounts given to customers who were going to cancel regardless.
SaaS CRR Benchmarks by Segment (2026)
Use these ranges to assess where your number stands
| Segment | Annual Logo CRR | Annual GRR | Notes |
|---|---|---|---|
| SMB SaaS (ACV < $5K) | 70–80% | 80–85% | High churn; price sensitivity and low switching costs |
| Mid-Market (ACV $5K–$25K) | 80–88% | 85–92% | CS coverage gap is the main driver of below-benchmark CRR |
| Enterprise (ACV > $25K) | 88–95% | 90–95% | Champion departure and budget cuts are primary risks |
| Top Quartile (all segments) | > 90% | > 95% | Structured CS motion + save-offer framework in place |
Many B2B SaaS teams target annual logo retention above 85% and churn below 5–7% annually. Enterprise-focused teams at higher ARR levels often report achieving near 94% GRR.
The 3 Root Causes Behind Low Logo CRR
Most logo CRR problems trace back to three of the five core root causes of SaaS churn:
- Low Product Engagement — customers never reached their activation milestone; they churn at renewal because the product never became a habit. Fix: trigger-based onboarding sequences targeting the first 30 days
- Poor Fit / Wrong ICP — customers were acquired outside the ideal profile; no CS motion fixes structural misalignment. Fix: ICP audit on the churned cohort, adjust acquisition targeting upstream
- Budget Pressure — customers have outcome evidence but can no longer justify the cost. Fix: save-offer hierarchy (pause → downgrade → discount), with a maximum discount of 20% for one billing cycle
Related: How to Reduce Churn Rate — root cause diagnostic framework with plays by segment.
First Actions by ARPA Tier
The same root cause warrants different responses depending on how much revenue is at stake per account:
| ARPA Tier | Trigger Signal | CS Action | Save-Offer Approach |
|---|---|---|---|
| Under $500/mo | Login gap > 14 days or feature adoption below threshold | Automated sequence — human outreach not economically justified | Pause only |
| $500–$2,000/mo | Health score drop below defined threshold before renewal window | CS-assisted — one structured check-in call before renewal | Pause → Downgrade |
| Above $2,000/mo | Exec sponsor disengagement or champion departure signal | Dedicated CSM — 90-day account plan + exec alignment quarterly | Pause → Downgrade → Discount (max 20%) |
Teams using a structured retention dashboard — like the one inside ChurnDefense — reduce time-to-insight from weeks to hours, which matters most at the ARPA tiers where intervention timing directly affects whether a renewal conversation happens at all.
FREE DEMO
Diagnose why your CRR is below benchmark — before your next renewal cycle
Book a free ChurnDefense demo and see how the root cause framework maps your at-risk accounts to the right retention play — automatically, by ARPA tier.
The Bottom Line
Customer retention rate is not a vanity metric — it is the foundation of SaaS unit economics.
A 5-percentage-point improvement in annual CRR compounds significantly: on a $5M ARR base with 85% logo retention, moving to 90% retention adds approximately $250K in preserved ARR per year without a single new customer acquired.
Calculate your customer retention rate formula correctly, track both logo and revenue versions..
CHURN DEFENSE
Stop guessing. Start retaining.
ChurnDefense gives CS leaders a single view of logo CRR, GRR, and cohort retention — segmented by ARPA, channel, and root cause. Book a free demo and see your retention data the way it was meant to be read.