What Is Customer Retention Rate? Formula, Benchmarks & SaaS Guide

Quick answer
Customer Retention Rate (CRR) measures the percentage of existing customers who stay over a defined period, excluding new acquisitions. The formula is CRR = ((CE – CN) / CS) × 100. Benchmarks vary by segment: Enterprise SaaS targets 92–95% annual CRR, Mid-Market 87–92%, and SMB 80–87%.
Quick Definition
Customer Retention Rate (CRR) is the percentage of customers a company retains over a specific period, excluding new customer acquisitions. For SaaS, it is typically measured monthly or annually and serves as the inverse of logo churn rate.
Retention dropped last quarter. You pulled the report, looked at the number, and still weren’t sure if it was a real problem or just noise.
That uncertainty is more common than most CS leaders admit — and it usually starts with measuring the wrong thing, or measuring the right thing incorrectly.
This guide covers exactly what customer retention rate means, how to calculate it without the common mistakes, and what a good number actually looks like for your SaaS company.
Not generic benchmarks. Segmented ones — by ARR tier, sales motion, and ARPA — because the same CRR can mean very different things depending on your business model.
By the end, you’ll have a clear formula, a benchmark range for your specific segment, and a framework for deciding when CRR is the right metric to optimize — and when it isn’t.
SEE IT IN ACTION
See how SaaS teams track CRR — and act on it faster
Book a free demo and see how ChurnDefense surfaces retention signals before they become churn.
What Is Customer Retention Rate (and What It Actually Measures)
Customer retention rate (CRR) measures the percentage of existing customers who stay with your company over a defined period. It excludes new customers acquired during that same window — which is a detail many teams get wrong when calculating it for the first time.
The metric answers one specific question: of all the customers you had at the start of a period, how many did you still have at the end?
That simplicity makes it one of the most universally tracked metrics in SaaS, but it also hides important nuance that becomes critical as your company scales.
CRR is a leading indicator of revenue stability. A consistently high retention rate signals that your product delivers recurring value.
A declining one — even a gradual one — is an early warning sign that compounds faster than most finance teams expect.
CRR vs. Churn Rate: Two Sides of the Same Coin
CRR and churn rate are mathematically inverse. If your monthly retention rate is 94%, your monthly churn rate is 6%. They measure the same dynamic from opposite directions.
The reason both exist is practical: different stakeholders prefer different framings.
Investors and board members tend to think in churn — it’s a loss metric that’s easy to benchmark against public SaaS data. CS teams tend to think in retention — it’s a success metric that reinforces the goal of keeping customers.
Neither is more correct. What matters is that your team uses one consistently and understands what it includes (and excludes).
Logo Retention vs. Revenue Retention: Why SaaS Needs Both
This is where many SaaS companies make a critical measurement mistake. Logo retention rate counts customers. Revenue retention rate counts dollars. They tell completely different stories.
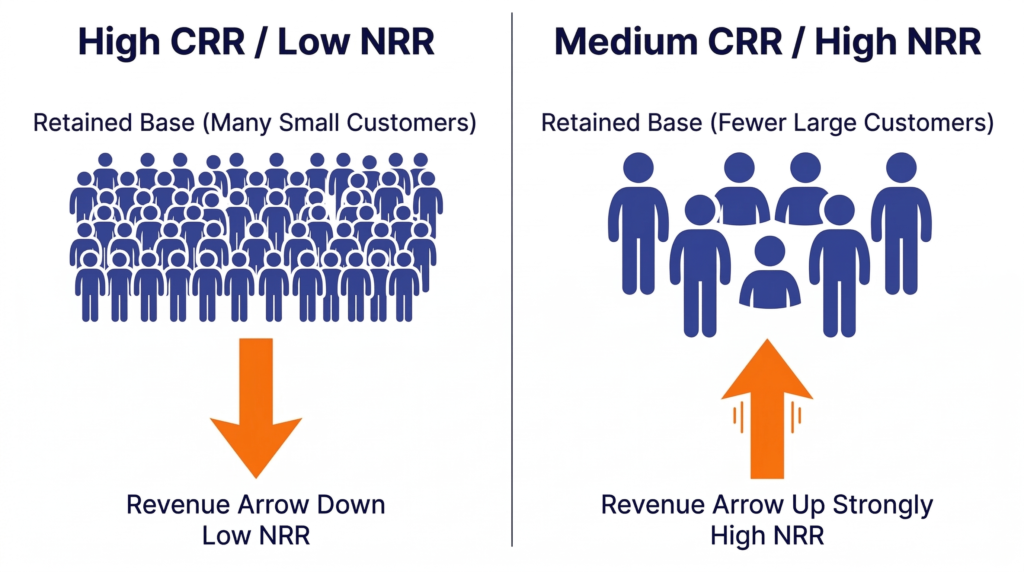
A company with 90% logo retention but 75% net revenue retention is quietly losing its most valuable accounts while retaining its smallest ones. The headline number looks healthy. The underlying business isn’t.
For SaaS companies above $1M ARR, tracking both metrics — together, not separately — is non-negotiable.
Customer retention rate gives you the volume signal. Net Revenue Retention (NRR) gives you the quality signal. You need both to make informed decisions about where to focus your CS resources.
Related: Customer Retention Strategy for SaaS — the complete framework for improving both metrics.
Customer Retention Rate Formula
The customer retention rate formula is: CRR = ((CE – CN) / CS) × 100 — where CE is the number of customers at the end of the period, CN is new customers acquired during the period, and CS is the number of customers at the start.
The formula itself is straightforward. The mistakes happen in how teams define each variable — especially CN. New customers acquired during the period must always be subtracted before calculating retention. Skipping that step inflates your CRR and masks real churn.
FORMULA
CRR = ((CE − CN) ÷ CS) × 100
- CS — Customers at the Start of the period
- CE — Customers at the End of the period
- CN — New customers acquired During the period
Step-by-Step Calculation With a Real SaaS Example
Say you run a B2B SaaS product with the following numbers for Q1:
- CS (start of quarter): 420 customers
- CE (end of quarter): 398 customers
- CN (new customers acquired in Q1): 35 customers
Applying the formula:
- Subtract new customers from end total: 398 − 35 = 363
- Divide by starting customers: 363 ÷ 420 = 0.864
- Multiply by 100: CRR = 86.4%
That means 86.4% of the customers you had on January 1st were still active on March 31st. The remaining 13.6% churned during the quarter — regardless of how many new accounts you signed.
The most common mistake: using CE directly without subtracting CN. In this example, that would give you 398 ÷ 420 = 94.8% — a 8.4 percentage point overstatement that completely changes how leadership perceives the retention health of the business.
COMMON MISTAKE
Forgetting to subtract new customers (CN) from CE before calculating CRR is the most frequent error in retention reporting. It artificially inflates your rate and delays corrective action by weeks or months.
Monthly vs. Annual CRR: When to Use Each
The same formula applies to both timeframes — the difference is in how you interpret and act on the result.
Monthly CRR is the operational metric. It’s sensitive enough to detect early signals — a product release that increased friction, a pricing change that triggered cancellations, an onboarding failure in a specific cohort.
If you’re running CS experiments or tracking the impact of a new save-offer program, monthly CRR gives you faster feedback loops.
Annual CRR is the strategic metric. It smooths out seasonal volatility and gives a cleaner picture of underlying retention health. It’s the number you present to the board, use in fundraising conversations, and benchmark against industry data.
For most SaaS companies between $1M and $20M ARR, tracking both is the right approach — monthly for operational decisions, annual for strategic ones.
Teams that only track annual CRR often miss emerging churn patterns until they’ve compounded into a material problem.
Related: SaaS Churn Rate Formula — how monthly churn compounds into annual churn, with calculator.
Customer Retention Rate Benchmarks by Segment
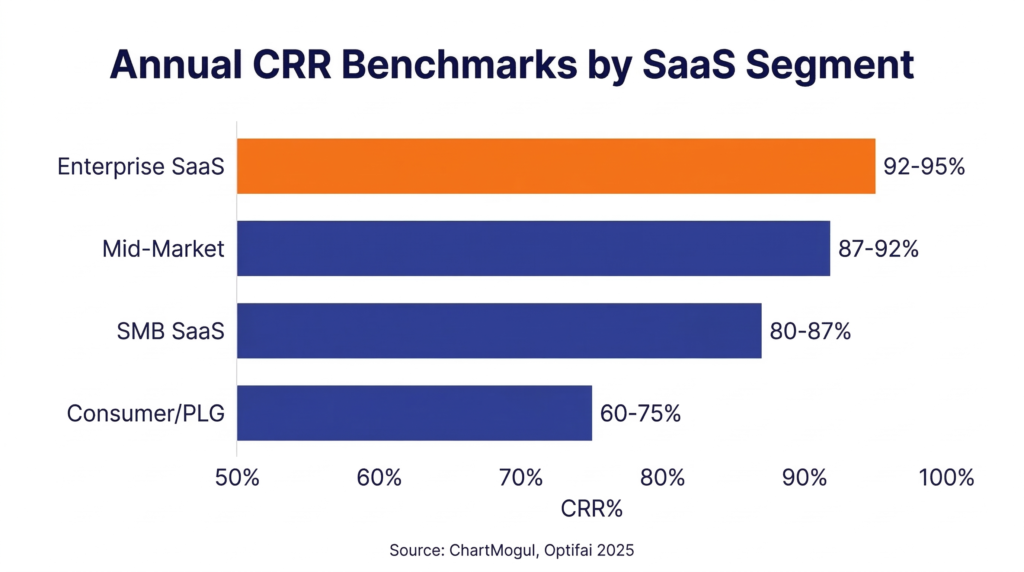
A “good” customer retention rate in SaaS is not a single number — it depends on your ARPA, sales motion, and ARR tier.
Using a generic benchmark like “90% is good” leads teams to celebrate numbers they should be investigating, or panic over numbers that are actually healthy for their segment.
Here is what the data actually shows across B2B SaaS companies in 2025-2026.
| Segment | ARPA | Target CRR (Annual) | Top Quartile NRR |
|---|---|---|---|
| Enterprise SaaS | ACV > $100K | 92–95% | > 130% |
| Mid-Market SaaS | ACV $25K–$100K | 87–92% | > 120% |
| SMB SaaS | ACV < $25K | 80–87% | > 105% |
| Consumer / PLG SaaS | ARPA < $25/mo | 60–75% | Rarely > 100% |
Sources: ChartMogul SaaS Retention Report (N=2,100), Optifai Pipeline Study 2025 (N=939), TechCrunch SaaS Benchmarks
Enterprise SaaS: 92–95% Annual CRR
Enterprise accounts have structured procurement, multi-year contracts, and deep product integrations — all of which create natural retention friction.
Annual CRR targets of 92–95% are standard, with top-quartile companies achieving NRR above 130% driven by seat expansion and module upsells.
Below 90% in this segment is a serious signal. Enterprise churn is rarely spontaneous — it builds over months through unresolved support issues, underutilization, or a failed executive sponsor relationship. By the time a logo churns, the warning signs were usually visible 60-90 days earlier.
SMB SaaS: Why 80% Can Be Perfectly Healthy
SMB SaaS companies operate under fundamentally different dynamics. Shorter contracts, faster buying decisions, and higher sensitivity to price changes mean CRR naturally sits lower.
An 83% annual retention rate for an SMB-focused product is not a retention failure — it’s the expected baseline.
The problem is when SMB teams benchmark against Enterprise numbers and over-invest in save programs for accounts that were never viable long-term fits.
The right question for SMB SaaS isn’t “how do we get to 92%?” — it’s “are we retaining the right customers at the right cost?”
Why ARPA Changes Everything
ARPA is the single strongest predictor of retention potential in B2B SaaS.
Companies with ARPA above $500/month have a top-quartile logo retention rate of 85%+ and 41% of them achieve NRR above 100% — compared to just 2.7% of companies with ARPA below $10/month.
This isn’t about product quality. It’s about customer profile. Higher ARPA customers have more at stake, more internal users dependent on the product, and more expansion surface area. Lower ARPA customers make faster, less considered decisions — in both directions.
Related: Average Customer Retention Rate by Industry — benchmarks broken down by vertical, including fintech, HR tech, and professional services.
FREE DEMO
See how your CRR compares to your segment
Book a demo and see how ChurnDefense tracks CRR, NRR and churn signals by ARR tier, ARPA range, and sales motion — in one view.
CRR vs. NRR: Why You Need Both Metrics
CRR tells you how many customers stayed. NRR tells you how much revenue stayed — and grew.
A company can post 88% logo retention and still expand revenue 15% year-over-year. Conversely, a company with 93% CRR can have NRR below 100% if remaining customers are consistently downgrading.
Tracking only one of these metrics creates a blind spot that compounds quietly until it shows up in ARR growth — usually later than anyone expected.
A Company Can Have 85% CRR and Still Grow Revenue
This scenario is more common than it seems, especially in mid-market and enterprise SaaS with strong expansion motions.
If your top 20% of accounts are expanding by 25% annually, the revenue gained from those expansions can more than offset the MRR lost from churned smaller accounts.
This is why investors and board members increasingly focus on NRR as the primary health metric — it captures the full picture of what’s happening inside your existing customer base, not just whether accounts are active or inactive.
When to Prioritize CRR Over NRR
NRR is the superior metric for revenue forecasting. But CRR remains the more actionable metric for CS teams in two specific scenarios:
- Early-stage SaaS ($0-$2M ARR): Expansion revenue is minimal, so NRR and CRR move almost identically. CRR is simpler to track and easier to tie to CS interventions at this stage.
- High-volume SMB models: When you have hundreds or thousands of small accounts, logo retention is a more reliable signal of product-market fit than revenue retention, which can be distorted by a handful of large downgrades.
For companies above $5M ARR with a dedicated CS function, the right answer is always to track both — and to have a clear internal definition of which metric triggers which type of response.
Teams using a structured retention dashboard that surfaces both CRR and NRR side by side — like the one inside ChurnDefense — consistently reduce time-to-insight when a retention problem begins to surface.
Related: How to Reduce Customer Churn — the complete root-cause playbook for CS teams.
How to Improve Your Customer Retention Rate
Before running any retention play, diagnose the root cause of your churn. Applying a save-offer program to accounts churning because of poor onboarding is as ineffective as redesigning your onboarding for accounts leaving due to pricing.
The plays below only work when applied to the right segment, at the right time.
The fastest path to CRR improvement in 90 days isn’t more outreach — it’s better signal. Identify which customer cohort is driving the most logo churn, understand why they’re leaving, and address that specific failure mode before scaling any tactic.
Play 1 — Build a 30-Day Onboarding Health Score
The majority of churn in B2B SaaS is decided within the first 30-60 days, long before any CS team flags the account as at-risk. Customers who don’t reach a clear activation milestone in the first month are 3-4x more likely to churn before their first renewal.
The play: define one measurable activation event that correlates with long-term retention in your product — the moment a customer first extracts real value.
Track the percentage of new accounts reaching that event within 30 days. Below 60% is a critical threshold that requires immediate onboarding intervention, regardless of how your overall CRR looks.
Play 2 — Segment Your At-Risk Accounts by Churn Reason
Not all at-risk accounts are the same, and treating them identically destroys both CS efficiency and customer trust. The three most common churn drivers in B2B SaaS — low usage, internal champion departure, and budget pressure — each require a completely different response.
The play: implement a structured churn reason taxonomy in your CRM. Every churned or at-risk account gets tagged with a primary reason.
After 60 days, you’ll have enough signal to identify which reason is driving the most logo churn — and that’s where your CS investment should concentrate first.
Play 3 — Design a Tiered Save-Offer Framework
Reactive discounting is one of the most expensive and least effective retention tactics in SaaS. It trains customers to wait for an offer before renewing, erodes margins, and rarely addresses the underlying reason for cancellation.
A tiered save-offer framework replaces reactive discounting with a structured decision tree: which accounts get a pause option, which get a downgrade path, which get an extended trial of a higher tier, and which get a direct conversation with a senior CS rep.
The offer matches the churn signal — not the account size or the rep’s gut feeling.
FRAMEWORK NOTE
Teams with a structured save-offer framework — segmented by ARPA, tenure, and churn reason — consistently outperform ad-hoc approaches on save rate by 18-24 percentage points, without increasing discount depth.
Related: Save-Offer Frameworks That Actually Work — decision trees by segment, discount guardrails, and experimentation design. Coming soon
READY TO ACT ON YOUR DATA?
Turn your retention metrics into a clear action plan
See how CS teams use ChurnDefense to diagnose root-cause churn, segment at-risk accounts, and run structured save-offer plays — without adding headcount.