How to Reduce Churn Rate in SaaS: The Complete Playbook (2026)

Quick answer
To reduce churn rate in SaaS, start by separating voluntary from involuntary churn, then diagnose the root cause driving the most MRR loss before applying segmented plays by ARPA tier. The playbook covers four steps in sequence: diagnosis, segmented plays, prioritization, and cadence.
Quick Answer
To reduce churn rate in SaaS, start by separating voluntary from involuntary churn, identify the root cause driving the most MRR loss, then apply segmented plays by ARPA tier. Tactics applied without diagnosis consistently underperform — regardless of execution quality.
Knowing how to reduce churn rate is one thing. Building a system that actually moves the number is another. Your MRR churn ticked up two months in a row, your CS team is already stretched, and you’ve tried better onboarding, more check-in calls, and a discount program — and the metric still isn’t moving in the right direction.
The problem usually isn’t effort. It’s sequence. Most churn reduction frameworks skip straight to tactics without first diagnosing which type of churn is driving the loss, which segments are most at risk, and which plays have the highest return given your team’s current capacity.
This playbook fixes that. It covers four steps — diagnosis, segmented plays, prioritization, and cadence — in the order that actually produces results.
Some industry analyses suggest that SaaS companies implementing structured churn diagnosis before running retention plays may reduce MRR churn faster than those applying tactics without a diagnostic layer first.
The framework applies to B2B SaaS companies between $500K and $50M ARR with at least one dedicated CS function.
If you’re earlier than that, start with the diagnosis section and apply the highest-leverage play for your top churn reason.
Why Most Efforts to Reduce Churn Rate Fail
Most churn reduction programs fail not because the tactics are wrong, but because they’re applied to the wrong problem. A save-offer program won’t retain customers churning due to poor product fit.
Better onboarding won’t recover accounts lost because their internal champion left. The mismatch between tactic and root cause is where most CS investment gets wasted.
After analyzing retention programs across SaaS companies, the pattern is consistent: teams that skip diagnosis and go straight to execution spend 60-70% of their CS bandwidth on plays that don’t address the actual reason customers are leaving.
Treating All Churn the Same: Voluntary vs. Involuntary
The first and most consequential mistake is aggregating all churn into a single metric without separating its two fundamentally different types.
Voluntary churn is a deliberate decision — the customer actively chose to cancel. The cause can be poor fit, low engagement, budget pressure, competitive loss, or a champion departure. Each requires a different response.
Involuntary churn is passive — the customer didn’t decide to leave, but a failed payment or expired card ended their subscription. For most B2B SaaS companies between $1M and $10M ARR, involuntary churn accounts for 20-40% of total logo churn.
It’s also the most recoverable — a structured dunning sequence alone can recapture 40-60% of failed payments before they result in cancellation.
Treating both types with the same retention playbook dilutes both efforts.
Your voluntary churn plays need behavioral data and CS judgment. Your involuntary churn plays need payment recovery automation. They belong in separate workflows.
Applying Tactics Before Diagnosing Root Cause
The second failure mode is running tactics on undiagnosed churn. This is the equivalent of prescribing medication before running tests — you might get lucky, but the odds are against you.
Common examples: launching a discount program when the real issue is low product adoption; redesigning onboarding when the real issue is wrong ICP being closed by sales; adding more CS touchpoints when the real issue is a billing integration failure causing false cancellations.
Each of these wastes months of CS capacity and often introduces new problems — discount addiction, onboarding fatigue, over-monitored accounts that still churn.
The 80/20 of Churn: Where Most MRR Loss Actually Comes From
In most SaaS companies, two or three churn reasons explain 70-80% of MRR loss — and those reasons are highly specific to your product, your ICP, and your current growth stage.
The goal of diagnosis isn’t to understand every churn reason.
It’s to identify the top one or two that are driving the most revenue loss right now — and fix those before spreading effort across a long list of marginal improvements.
Related: How to Reduce Customer Churn — the root-cause taxonomy and full play list by segment.
FREE DEMO
See how CS teams diagnose and act on churn signals faster
Book a free demo and see how ChurnDefense surfaces voluntary vs. involuntary churn signals before they compound into material MRR loss.
Step 1: Diagnose Before You Act
The first step in any effective churn reduction program is building a shared, structured understanding of why customers are leaving — before running a single retention play.
Without this foundation, your team will optimize for activity rather than impact, and your churn rate will stay flat regardless of how many new initiatives you launch.
Diagnosis doesn’t require a data science team or a six-month research project. It requires a consistent tagging system, a 30-day commitment to applying it, and a weekly review cadence to spot patterns.
The Churn Taxonomy: 5 Root Causes That Explain 90% of SaaS Churn
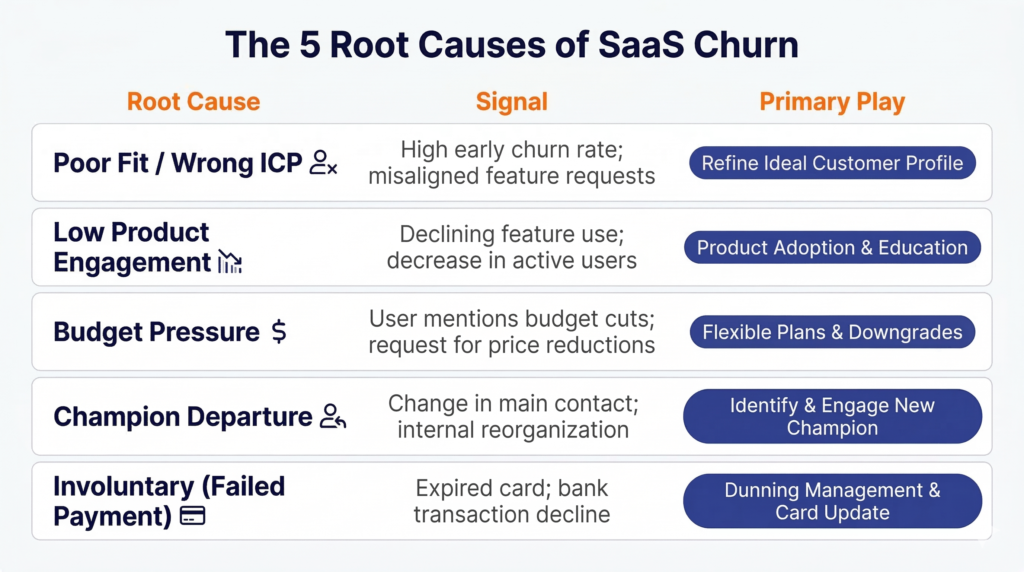
Across B2B SaaS companies, the overwhelming majority of voluntary churn traces back to five root causes. Each one requires a fundamentally different response and confusing one for another is the most common reason retention plays underperform.
The 5 Churn Root Causes — B2B SaaS
| Root Cause | Signal | Primary Play |
|---|---|---|
| Poor fit / wrong ICP | Low activation, cancels in first 90 days | ICP audit + sales handoff fix |
| Low product engagement | Usage drop 30+ days before cancel | In-app nudges + CS outreach trigger |
| Budget pressure | Cost objection in exit survey | Save-offer (pause / downgrade) |
| Champion departure | Sponsor contact gone silent | Multi-threading + new onboarding |
| Involuntary (failed payment) | Payment failure with no cancellation intent | Dunning sequence + card updater |
One important note: customers rarely give you the real root cause unprompted. “Too expensive” is the most common exit survey answer — but in most cases, price is a proxy for perceived value, not a true budget constraint. A customer who doesn’t see ROI will always feel the price is too high.
How to Identify Which Root Cause Is Driving Your Churn Right Now
You don’t need to categorize every churned account to find your dominant root cause. A focused 30-day sprint on a representative sample is enough to surface the pattern.
Three inputs that, combined, give you a reliable diagnosis:
- Exit survey data — bias toward stated reasons, but useful for directional signal. Keep it to 3 questions maximum. More than that and completion rates drop below 20%.
- Product usage data — pull login frequency, feature adoption, and last active date for the 30 days before cancellation for each churned account. A usage cliff 3-5 weeks before cancel is a consistent engagement churn signal.
- CSM qualitative notes — the closest thing to ground truth. A 15-minute structured debrief per churned account with your CS team will often surface patterns that surveys and usage data miss entirely.
Run this for 20-30 churned accounts. In most SaaS companies, one or two root causes will appear in 60-70% of cases. That concentration is your starting point.
Building a Churn Reason Tagging System in Your CRM
The goal of a tagging system is to make root cause data accumulate passively over time — so you stop re-diagnosing from scratch every quarter and start spotting trends as they emerge.
A functional tagging system needs three components:
- A fixed taxonomy — use the five root causes above as your primary tags. Add product-specific sub-tags only if you have enough volume to make sub-categories statistically meaningful (typically 50+ churns/month).
- A mandatory field at cancellation close — make the root cause tag a required field when any CS rep marks an account as churned in your CRM. Optional fields don’t get filled.
- A monthly review ritual — tag distribution by root cause, MRR lost per root cause, and trend vs. prior month. This 20-minute review will consistently surface your highest-leverage retention opportunity.
Teams using a structured cancellation tagging system — the type embedded in ChurnDefense’s diagnostic layer — typically reach statistically reliable root cause data within 6-8 weeks of implementation, even at lower churn volumes.
COMMON MISTAKE
Building a tagging system with too many categories. If your taxonomy has more than 7-8 primary tags, CSMs will start applying them inconsistently — and your data becomes unreliable within weeks. Start narrow. Expand only when volume justifies it.
Self-Assessment · 5 Questions
What’s Driving Your Churn Right Now?
Answer 5 quick questions and find out which root cause is behind your MRR loss — and the exact play to fix it.
Question 1 of 5
When do most of your churned customers typically cancel?
Within the first 30-90 days after signup
After a period of declining usage (3-6 months in)
At renewal — citing cost or budget cuts
After a key contact at the company changes roles or leaves
Passively — without a cancellation request (payment failures)
Question 2 of 5
What does your exit survey data (or CSM notes) most commonly show as the reason for cancellation?
“The product doesn’t do what we need” or feature gaps
“We stopped using it” or “our team never fully adopted it”
“Too expensive” or “cutting costs this quarter”
“New team / new priorities” or no response at all
No stated reason — account just lapsed
Question 3 of 5
What does product usage look like for accounts that end up churning?
Low from day one — they never fully activated
Started well, then dropped significantly weeks before cancellation
Usage was decent but they still cancelled — price was the issue
Usage dropped after a specific user went inactive
Usage was normal — the account just stopped paying
Question 4 of 5
What is your average revenue per account (ARPA) per month?
Under $500/month — mostly self-serve or SMB accounts
$500–$2,000/month — mix of self-serve and sales-assisted
$2,000+/month — Mid-Market or Enterprise, CS-led
Question 5 of 5
Does your CS team currently have a structured process for identifying at-risk accounts before they request cancellation?
No — we mostly find out when the cancellation request arrives
Partially — we have some alerts but no consistent playbook
Yes — we have defined triggers, plays, and a review cadence
Your Root Cause
Recommended Play
↩ Start over
Step 2: Plays by Root Cause and ARPA Segment
Once you’ve identified your dominant root cause, the next step is selecting the right play — and adjusting its execution based on your customer’s ARPA tier.
A save-offer that works for a $200/month SMB account will damage the relationship with a $3,000/month enterprise customer. Segment matters as much as the play itself.
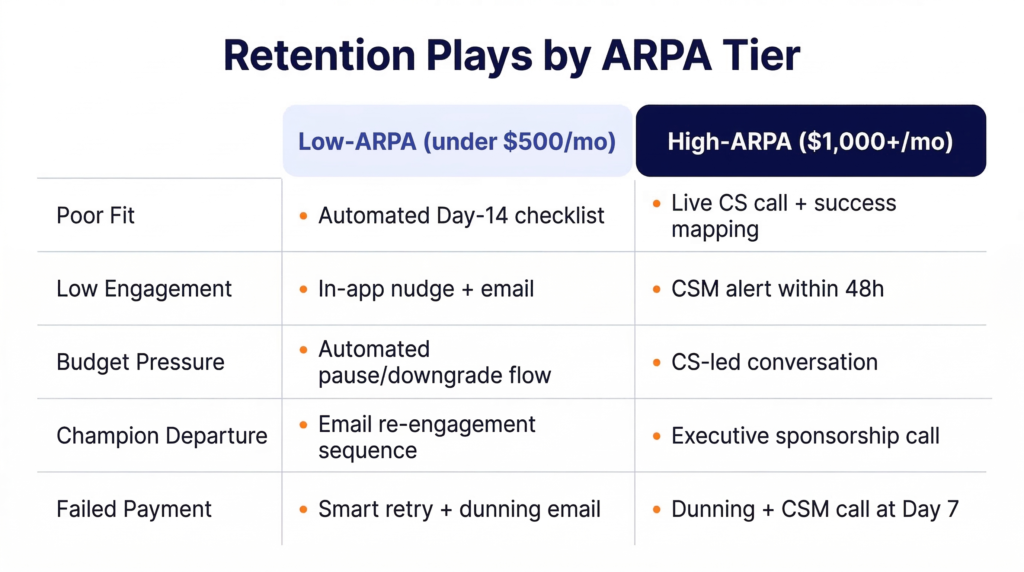
The five plays below map directly to the root cause taxonomy from the previous section. Each includes a low-ARPA and high-ARPA variant so you can apply them without guessing.
Poor Fit / Wrong ICP → Activation Plays
Customers churning due to poor fit almost always show the same pattern: they activated partially, never reached their first value moment, and cancelled within 30-90 days. The root cause is rarely the product — it’s a sales-to-CS handoff failure or an ICP definition problem upstream.
What to do:
- Pull every account that cancelled within 90 days of signup for the past 6 months. Identify their original lead source, sales rep, and company profile.
- If a pattern emerges (e.g., a specific vertical, company size, or use case), bring it back to sales leadership as an ICP refinement conversation — not a CS problem.
- For accounts still in this risk window: trigger a structured “Day 14 health check” from CS. Not a check-in call — a specific review of whether the customer has completed the 2-3 activation milestones that predict long-term retention in your product.
ARPA adjustment:
- Low-ARPA (under $500/month): automate the Day 14 health check via in-app checklist or email sequence. CS time doesn’t pencil at this tier.
- High-ARPA ($1,000+/month): live call, screen share, direct mapping of the customer’s original success criteria to specific product features. This investment pays back in 1-2 retained months.
Low Product Engagement → Usage Nudge Plays
Engagement churn is the most predictable type — and therefore the most preventable. Usage data almost always shows a clear drop 3-5 weeks before the cancellation request arrives. The problem is that most CS teams don’t have a systematic trigger watching for that signal.
What to do:
- Define your “engagement floor” — the minimum usage threshold below which an account is at material churn risk. For most SaaS products this is 2-3 key actions per week for the primary user. Instrument this in your analytics tool.
- Set an automated alert when any account crosses below that threshold for 7+ consecutive days. Route it to the owning CSM with account context pre-populated.
- The intervention goal is not to check in — it’s to remove a specific obstacle. Ask: “What’s the last workflow you were trying to complete in the product?” Then solve that one thing.
ARPA adjustment:
- Low-ARPA: in-app nudge + re-engagement email sequence. No CSM involvement unless account has expansion potential.
- High-ARPA: CSM-triggered call within 48 hours of alert. Bring a concrete re-engagement agenda — not a generic “how’s it going.”
Budget Pressure → Save-Offer Plays
Budget pressure is the most commonly overstated churn reason — and the most dangerous one to respond to with an automatic discount. As noted in the diagnosis section, most “it’s too expensive” exits are actually perceived value gaps in disguise.
The rule: diagnose before offering. One qualifying question before any save-offer: “If the price weren’t a factor, would you continue using the product?”
If the answer is no, a discount won’t save the account — it will only delay the churn and train the customer to expect lower pricing at renewal.
What to do:
- Gate your save-offers behind a short cancellation flow survey. Three questions: reason, satisfaction score, and the qualifying question above.
- Offer a hierarchy of options — in this order: pause (if you have it), downgrade, discount. Lead with pause because it preserves the relationship without eroding pricing integrity.
- Set a hard limit: no more than one save-offer per account per 12-month period. Customers who receive repeated discounts have significantly lower NPS and higher long-term churn rates than those who pay full price.
PRICING GUARDRAIL
A discount save-offer should never exceed 20% of ARR for more than one billing cycle. Beyond that threshold, you’re subsidizing a customer who was never profitable at your standard price — and signaling to the rest of your base that negotiation at cancellation is a viable strategy.
ARPA adjustment:
- Low-ARPA: automate the save-offer flow inside the cancellation page. Pause or downgrade only — no human-negotiated discounts at this tier.
- High-ARPA: CS-led conversation. Never present a save-offer in a cancellation portal for accounts above $1,000/month ARR — it signals low relationship value and often backfires.
Champion Departure → Relationship Continuity Plays
Champion departure is the most underestimated churn driver in Mid-Market and Enterprise SaaS.
When the internal sponsor who drove the original buying decision leaves, the account enters a vulnerability window — typically 60-90 days — during which a new stakeholder will re-evaluate every tool in the stack.
What to do:
- Track sponsor-level contacts in your CRM with a “champion” tag. Set a 30-day inactivity alert: if your champion hasn’t logged in or responded to CS in 30 days, flag the account for review.
- When a champion departure is confirmed, trigger a two-step response: (1) identify the incoming stakeholder within 48 hours via the account’s admin user or LinkedIn; (2) request a formal re-onboarding call framed as a “new stakeholder orientation” — not a retention call.
- Bring a business case document to that call: outcomes the account has achieved, integrations in place, and migration cost if they switch. Make the cost of leaving tangible and concrete.
ARPA adjustment:
- Low-ARPA: automate a “meet your new champion” email sequence triggered by sponsor inactivity. Lightweight, but plants the flag.
- High-ARPA: executive sponsorship engagement. Your VP CS or CEO should be on that re-onboarding call for accounts above $5,000/month ARR.
Involuntary Churn → Payment Recovery Plays
Involuntary churn is uniquely recoverable because there’s no dissatisfaction driving it — only a payment failure. A well-designed dunning sequence recovers 40-60% of failed payments before they result in cancellation.
What to do:
- Implement a smart retry logic: retry failed payments at day 1, day 3, day 7, and day 14 — not on a fixed calendar. Card networks have higher authorization rates on certain days and times; most payment processors expose this data.
- Run a parallel email sequence alongside the retries. Day 1: transactional alert. Day 3: soft reminder. Day 7: urgency + direct update link. Day 14: final notice with a clear reactivation path if the account does lapse.
- Enable card account updater if your payment processor supports it (Stripe, Braintree, and Adyen all do). It automatically updates expired card details in the background — and alone accounts for recovering 10-15% of involuntary churn with zero CS involvement.
ARPA adjustment: involuntary churn plays are largely ARPA-agnostic on the automation side. Add a personal outreach call from CS for accounts above $2,000/month ARR if automated retries fail by day 7.
Related: Reduce Churn in SaaS — quick-reference plays by segment with implementation timelines.
Step 3: Prioritize Experiments With Limited CS Resources
The biggest mistake CS teams make after completing diagnosis is trying to fix everything at once. With limited headcount and competing priorities, running five retention plays simultaneously means running all of them badly.
The goal of this step is to identify the one or two plays with the highest expected return given your team’s current capacity — and execute those well before expanding.
The Impact vs. Effort Matrix for Retention Plays
Not all retention plays are equal in their return-to-effort ratio.
Before committing CS bandwidth to any initiative, map each candidate play on two dimensions: estimated MRR at risk (the amount of revenue the root cause is currently costing you per month) and implementation complexity (time to deploy, dependencies, and skill requirements).
Retention Play Prioritization Matrix
| Play | Typical MRR Recovery | Time to Deploy | Priority |
|---|---|---|---|
| Dunning sequence (involuntary) | 40-60% of failed payment MRR | 1-2 weeks | Run first |
| Engagement alert + CS trigger | 20-35% of at-risk MRR | 2-3 weeks | Run first |
| Save-offer cancellation flow | 15-25% of voluntary cancel MRR | 2-4 weeks | Second wave |
| Champion departure protocol | Highly variable — high ARPA only | 3-5 weeks | Second wave |
| ICP refinement + sales handoff fix | Long-term — prevents future churn | 6-12 weeks | Third wave |
The two “Run first” plays — dunning and engagement alerts — share a critical characteristic: they are largely automated once deployed, require minimal ongoing CS bandwidth, and produce measurable results within 30-60 days.
That combination makes them the highest-return starting point for virtually any SaaS team regardless of size.
What to Fix First at $1M ARR vs. $10M ARR
Your ARR stage shapes which plays deserve priority — not because the root causes differ dramatically, but because your team’s capacity and the MRR at stake at each tier changes what’s worth building first.
At $1M ARR:
- Dunning sequence is non-negotiable — deploy this week if you haven’t.
- One engagement trigger rule (usage cliff alert) is enough. Don’t overbuild.
- Save-offer flow for self-serve cancellations if you have more than 20 churns/month.
- Everything else is premature optimization at this stage.
At $10M ARR:
- Full five-play stack should be operational.
- Champion departure protocol is now material — Mid-Market accounts represent enough MRR to justify CSM time investment.
- ICP refinement conversation with sales should be happening quarterly based on cohort data.
- CS capacity should be segmented: high-touch for $2,000+/month accounts, tech-touch or automated for below.
How to Measure If a Play Is Actually Working
Every retention play needs a single primary metric defined before launch — not after. Without a pre-defined success metric, you’ll rationalize inconclusive results and run plays indefinitely without knowing if they’re working.
The three metrics that matter most:
- Save rate — percentage of at-risk accounts that did not churn after the play was triggered. Baseline target: 20-30% for engagement plays, 40-60% for dunning.
- MRR recovered — absolute dollar amount retained per month attributable to the play. This is the metric that justifies CS headcount and tooling investment to leadership.
- Time to result — how many days between trigger and confirmed retention outcome. Plays that take more than 30 days to show results are hard to iterate on — and CS teams lose confidence in them quickly.
Teams using a structured retention dashboard — like the one inside ChurnDefense — reduce time-to-insight on play performance by surfacing save rate and MRR recovered in a single view, without requiring manual CRM exports.
FREE DEMO
See your save rate and MRR recovered in one view
Book a free demo and see how ChurnDefense tracks play performance across your full retention stack — without manual CRM exports.
Step 4: Build a Churn Reduction Rhythm
Retention is not a project — it’s an operational cadence.
The teams that consistently reduce churn over time aren’t running harder than their peers; they’re running a more structured review rhythm that surfaces problems earlier and closes the feedback loop between plays and outcomes faster.
Three cadences, three different time horizons.
Weekly CS Review Cadence
The weekly review is tactical. Its purpose is to catch individual accounts in the early stages of churn risk before they reach the cancellation stage — when intervention options are still broad.
A functional weekly CS review takes 20-30 minutes and covers four items:
- New at-risk accounts flagged this week — engagement alerts triggered, champion inactivity alerts, or support escalations from the prior 7 days.
- Open save attempts in progress — status update on any account currently in a retention play. Is the play on track? Does it need escalation?
- Accounts that churned this week — root cause tag applied? Was the churn preventable? What would have changed the outcome?
- One pattern observation — is this week’s risk distribution consistent with last week, or is something shifting? Pattern recognition at this frequency catches structural problems 4-6 weeks before they show up in monthly churn metrics.
Monthly Cohort Analysis
The monthly review is diagnostic at scale. Its primary output is the root cause distribution for the month — which of the five root causes drove the most MRR loss, and how that compares to the prior month and to the same month last year.
Two additional analyses belong in the monthly review:
- Cohort survival curves by acquisition channel and ICP segment — which customer cohorts are retaining and which are degrading. This is the data that informs the ICP refinement conversation with sales.
- Play effectiveness scorecard — save rate and MRR recovered for each active retention play. Any play that has been running for 60+ days with a save rate below 15% should be redesigned or retired.
Related: Customer Retention Strategy for SaaS — how to build the full retention operating model, including dashboard structure and quarterly review framework.
Quarterly Playbook Audit
The quarterly audit is strategic. Its purpose is to ensure your retention playbook reflects your current product, ICP, and growth stage — not the company you were 12 months ago.
Three questions that structure a useful quarterly audit:
- Has our dominant root cause shifted? If poor fit was driving 40% of churn last quarter and this quarter it’s dropped to 15%, your ICP refinement work is paying off — and a different root cause has likely taken its place. Reallocate play investment accordingly.
- Are our ARPA tiers still correctly defined? As you grow, the distribution of account sizes shifts. Plays calibrated for a $500/month average may need adjustment when your median account is now $1,200/month.
- Which plays should we retire? A play that was high-impact 18 months ago may now be producing diminishing returns because the underlying root cause has been structurally addressed. Retiring plays that no longer move the needle frees CS bandwidth for new experiments.