Churn Reduction Strategies: A Root-Cause Playbook for SaaS

Quick answer
The most effective churn reduction strategies are organized by root cause rather than applied uniformly: Poor ICP Fit, Low Product Engagement, Budget Pressure, Champion Departure, and Involuntary Churn (failed payments). Each cause has a distinct early-warning signal, a specific play, and a clear owner. Generic tactics applied without diagnosis typically achieve 5–8% save rates, while cause-matched plays regularly exceed 20%. Diagnose which cause drives the largest share of your churned MRR before you prescribe a fix.
You added onboarding emails. You launched NPS surveys. You assigned a CSM to every flagged account. Churn is still above 5%.
The problem is rarely the tactic — it’s the missing diagnosis step. Most CS teams apply the same retention plays to every at-risk account, regardless of why that account is about to leave.
An automated re-engagement sequence doesn’t help a customer who’s leaving because their budget was cut. A discount offer doesn’t help a customer leaving because their primary contact changed jobs two months ago.
This guide organizes every major churn reduction strategy around the root cause it actually addresses. The five root causes — Poor Fit/Wrong ICP, Low Product Engagement, Budget Pressure, Champion Departure, and Involuntary Churn — each demand a different play, a different owner, and a different measure of success.
This article is part of the complete guide to reducing customer churn; if you’re building a retention program from scratch, start there.
Some industry analyses suggest average annual SaaS churn sits between 5–8%. The companies that don’t move that number aren’t running no plays — they’re running the wrong ones.
See it in action. Want to see how ChurnDefense maps every at-risk signal to its root cause automatically?
Why Churn Reduction Strategies Often Miss the Mark
The most effective churn reduction strategies succeed not because they’re sophisticated, but because they’re matched to the right problem. Running the wrong play — even a well-executed one — wastes CS bandwidth and leaves recoverable revenue on the table. For a full overview of the retention framework, start with the complete guide to reducing customer churn.
The One-Size-Fits-All Trap
Most retention playbooks treat every at-risk account the same way: alert fires, CSM sends a check-in email, call gets scheduled, discount gets offered.
That sequence is only appropriate for one of the five root causes — Budget Pressure — and even then, only after cheaper options have been attempted first.
The mismatch between tactic and cause creates three predictable failures:
- Low save rates — Root-cause-targeted interventions consistently achieve 20–30% save rates; generic approaches plateau at 5–8%
- Discount addiction — Customers learn to signal unhappiness in exchange for offers, which trains churn behavior and erodes margin over time
- CS bandwidth waste — Reps spend cycles on accounts that aren’t recoverable while missing the ones where a single well-timed call would have worked
A meaningful share of SaaS churn happens for reasons entirely within a company’s control. The bottleneck is almost never effort — it’s that the effort isn’t applied to the right cause.
Churn Benchmarks by Segment (2025–2026)
Before selecting a strategy, establish what you’re measuring against. Churn benchmarks differ significantly by customer segment — comparing your rate to the wrong baseline leads to complacency if you use an SMB average on a mid-market book, or misdirected urgency in the other direction.
| Segment | ARPA Range | Healthy Monthly Churn | Annual Equivalent |
|---|---|---|---|
| SMB | < $500 / mo | < 5% | < 46% annually |
| Mid-Market | $500 – $5K / mo | < 1% | < 8% annually |
| Enterprise | > $5K / mo | < 0.5% | < 6% annually |
Sources: SaaS Capital, ChartMogul (2025–2026)
For a more granular breakdown — including benchmarks by ARR stage, pricing model, and vertical — the ChurnDefense Benchmarks page compiles updated SaaS retention data updated quarterly.
Two important caveats on these numbers. First, your pricing model is itself a retention variable: usage-based pricing is often associated with lower churn than flat-rate subscriptions. Second, the revenue at stake makes precise targeting matter more than most teams realize.
Key Insight — A 1% monthly churn reduction in a $1M ARR business = $120K+ in retained annual revenue. The root cause determines whether that reduction takes 30 or 90 days — and which team actually owns the fix.
The 5 Root Causes of SaaS Churn — Signals and Plays
The five root causes of SaaS churn are: Poor Fit/Wrong ICP, Low Product Engagement, Budget Pressure, Champion Departure, and Involuntary Churn (failed payment). Each has a distinct early warning signal, a specific retention play, and a clear team owner. Matching the right play to the right cause is what separates a 6% save rate from a 25% one.
| Root Cause | Signal | Recommended Play | Owner |
|---|---|---|---|
| Poor Fit / Wrong ICP | Low activation · cancels within 90 days | ICP audit + Day-14 activation health check | Sales / Marketing |
| Low Product Engagement | Usage drop 30+ days before cancel | Engagement floor alert + CS outreach trigger | Product / CS |
| Budget Pressure | Cost objection in exit survey | Save-offer flow: pause → downgrade → discount | CS / Finance |
| Champion Departure | Primary contact inactive 30+ days | Champion alert + new stakeholder re-onboarding | CS / Account Mgmt |
| Involuntary (Failed Payment) | Payment failure · no cancel intent | Smart retry + dunning sequence + card updater | Finance / RevOps |
Root Cause 1 — Poor Fit / Wrong ICP
This is the only root cause that originates entirely before the customer signs. When sales or marketing qualifies accounts outside the Ideal Customer Profile — wrong company size, wrong use case, wrong maturity level — those customers churn fast and churn reliably, regardless of how well onboarding is executed.
The signal is consistent: low activation in the first two weeks, feature usage that never reaches depth, and cancellations concentrated in the first 90 days of the subscription.
No CS motion fixes this at the retention stage. The fix belongs to sales qualification and ICP definition.
Identifying which cohorts of churned accounts share ICP characteristics is the starting point — for a deeper breakdown of how ICP fit affects churn patterns, see how to reduce churn in SaaS.
Play: Run a quarterly ICP audit against churned accounts from the previous period. Implement a Day-14 activation health check — if a customer hasn’t reached your defined activation threshold by day 14, flag them for CS intervention before the pattern sets.
Root Cause 2 — Low Product Engagement
Usage drop is the most common and most recoverable root cause — and the one with the longest lead time. Customers rarely cancel the moment they stop using a product; they disengage weeks or months before the cancellation decision is made. That window is where intervention matters.
The signal to monitor is any sustained decline in usage below your defined engagement floor: login frequency, core feature activation rate, or DAU/MAU ratio — whichever metric correlates most strongly with renewal in your cohort data.
A large share of new SaaS users disengage within the first 30 days, and customers who complete structured onboarding are meaningfully more likely to remain active in their first week.
Play: Set an engagement floor alert that triggers a CS outreach sequence when usage drops below threshold for 14 consecutive days. The goal isn’t a discount — it’s understanding what changed and whether the product is still solving the right problem.
Root Cause 3 — Budget Pressure
Budget pressure is the only root cause where a financial incentive is genuinely appropriate. The challenge is that most teams reach for discounts first, which trains customers to signal price sensitivity in exchange for offers and erodes margin over time.
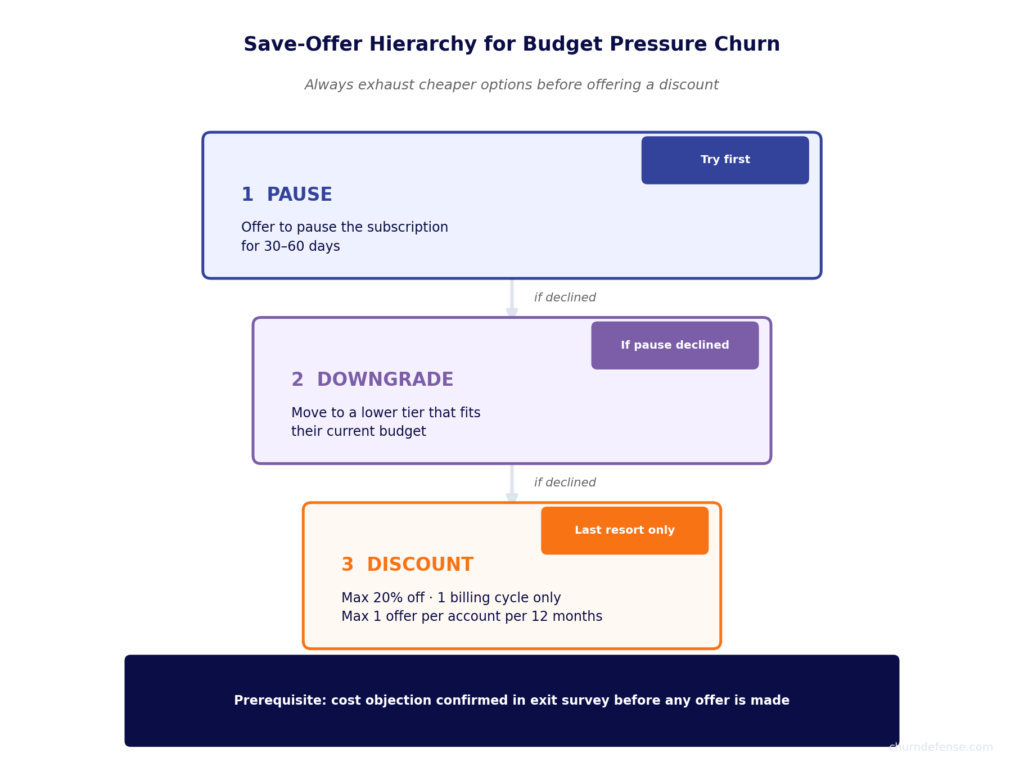
The correct hierarchy is: pause first → downgrade second → discount only as a last resort. When a customer who’s been engaged for 18 months suddenly raises cost as a concern, offer to pause their subscription for 30–60 days before touching the price.
A share of customers who receive personalized save-offers at the point of cancellation choose to stay rather than leave.
Guardrails that protect margin and trust:
- Maximum discount: 20% off, applied to one billing cycle only
- Maximum frequency: one save-offer per account per 12-month period
- Prerequisite: cost objection must be confirmed in exit survey or CS conversation before any offer is made
Root Cause 4 — Champion Departure
Champion departure is the most underdiagnosed root cause in B2B SaaS. When the person who bought the product, learned it, and advocated for it internally changes roles or leaves the company, their replacement has no emotional attachment to the tool — and often no onboarding into it. Churn follows within 60–90 days in most cases.
The signal is deceptively simple: the primary contact stops engaging with your product and your team for 30 or more consecutive days. LinkedIn job changes and email bounce patterns are secondary indicators worth monitoring.
Play: When the champion inactivity alert fires, don’t wait for renewal. Map alternative stakeholders within the account, schedule a re-onboarding session with the new contact, and reestablish value before the next billing cycle.
Champion departure is widely cited among the leading drivers of B2B SaaS churn — yet many CS teams still lack a defined playbook for it.
Root Cause 5 — Involuntary Churn (Failed Payment)
Involuntary churn is unique because the customer has not decided to leave. A failed credit card charge, an expired payment method, or a declined transaction triggered by a bank’s fraud logic — none of these represent cancellation intent. Yet without a recovery sequence, they result in account suspension and eventual churn.
Effective dunning is the highest-leverage, lowest-effort retention motion available. Some industry analyses suggest that a properly configured dunning workflow can recover a significant portion of involuntary churn. For a full breakdown of churn rate mechanics, see the guide to reducing your overall churn rate.
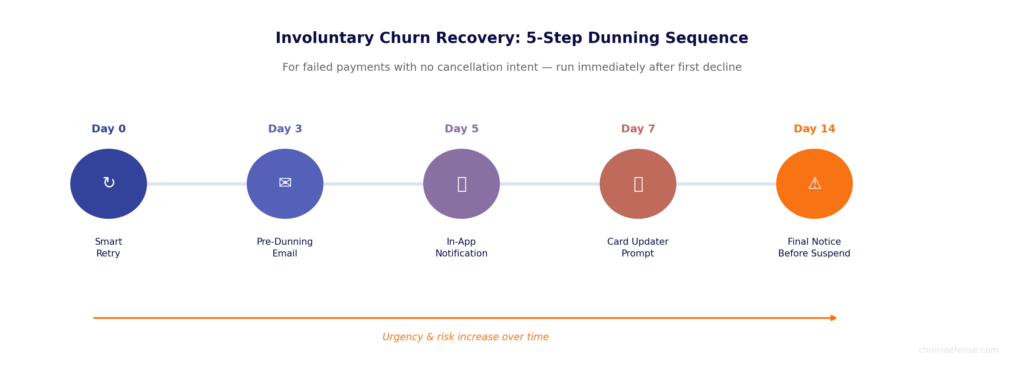
Recovery sequence:
- Day 0 — Smart retry immediately after first failure
- Day 3 — Transactional pre-dunning email (no blame, clear call-to-action)
- Day 5 — In-app notification on login
- Day 7 — Card updater prompt (automated where supported)
- Day 14 — Final email before account suspension
Self-Diagnostic
Which root cause is driving your churn?
Check every symptom you’re currently observing. The group with the most checks points to your dominant root cause.
Poor Fit / Wrong ICP
- Churn is concentrated in the first 90 days of subscription
- New customers never reach your activation milestone
Low Product Engagement
- Usage drops noticeably 4–6 weeks before cancellation
- Login frequency falls before the customer ever raises a complaint
Budget Pressure
- Exit surveys cite cost or ROI as the primary reason for leaving
- Churn spikes correlate with your customers’ budget cycles or layoffs
Champion Departure
- Churned accounts often had a contact change 60–90 days prior
- Primary contacts go dark for weeks before a cancellation request arrives
Involuntary (Failed Payment)
- A measurable % of churn comes from payment failures, not cancellation requests
- No automated retry or dunning sequence is currently active
How to Prioritize Your Churn Reduction Strategies
Prioritizing churn reduction strategies starts with one rule: diagnose before you prescribe. Identify which root cause is driving the largest share of your churned MRR, assign the matching play, and measure the leading indicator specific to that cause.
Running all five plays simultaneously without triage is impractical and produces data too diffuse to act on.
Diagnose Before You Prescribe
Segment your churned accounts from the past 90 days using three data sources: exit surveys (stated reason for leaving), product analytics (usage pattern in the 30 days prior to cancel), and cohort analysis (at what lifecycle stage did churn occur).
The intersection of these three answers points to your dominant root cause — the one to prioritize first.
If 40% of churned MRR cancelled within 60 days of signing and never activated core features, ICP mismatch is your primary problem. No engagement campaign or save-offer will address that faster than tightening qualification criteria upstream.
A meaningful share of SaaS churn happens for reasons within the company’s direct control — and identifying which reason comes first determines where that control actually applies.
5-Step Prioritization Framework
- Segment churned MRR by root cause — Pull the last 90 days of churned accounts. Tag each by exit-survey reason, lifecycle stage, and usage trend.
- Identify your dominant root cause — The cause tied to the highest % of churned MRR is your first priority, not the one easiest to fix.
- Assign the matching play and team owner — Use the root cause table above. One play, one owner, one 30-day window.
- Measure the leading indicator, not just churn rate — Churn rate is a lagging metric. Track the signal specific to your root cause (see table below).
- Re-segment every 90 days and iterate — As your dominant root cause shifts, your priority play shifts with it. This is a continuous loop, not a one-time fix.
Want to see these 5 plays mapped to your actual MRR at risk?
Sequence Matters — Fix Fit Before Fixing Engagement
There is a logical hierarchy to churn reduction that most programs violate. Investing in sophisticated engagement campaigns for customers who shouldn’t have been sold to in the first place creates a predictable loop: you retain bad-fit accounts temporarily, they churn at the next renewal anyway, and your short-term save-rate data looks artificially good.
The correct sequence runs upstream to downstream: ICP fit → onboarding and activation → engagement and usage → save-offer flows → dunning configuration.
Fixing a downstream problem before an upstream one is addressed wastes both effort and margin. Longer-term contracts are widely associated with lower churn — partly because multi-year commitments force both parties to establish fit before signing.
Measure What’s Working
Each root cause has a specific leading indicator that reflects whether your play is working before the renewal decision arrives. Tracking a single aggregate churn rate across the entire customer book masks which interventions are actually moving the number.
| Root Cause | Leading Metric to Track | Healthy Target |
|---|---|---|
| Poor Fit / Wrong ICP | Day-14 activation rate | > 60% |
| Low Product Engagement | % of accounts above engagement floor | > 85% |
| Budget Pressure | Save rate at point of cancellation | > 20% |
| Champion Departure | Stakeholder coverage ratio | > 1 contact |
| Involuntary | Failed payment recovery rate | > 80% |
The North Star metric that unifies all five plays is Net Revenue Retention (NRR). Unlike logo churn rate, NRR captures both the accounts lost and the revenue expanded — which means fixing ICP fit (fewer cancellations) and improving engagement (more upsell readiness) both move the same number upward.
For how to calculate and benchmark these metrics, see the SaaS churn rate formula guide.
ChurnDefense maps your MRR at risk to each root cause automatically.
Stop guessing which play to run. See exactly where your retention effort should go — before the cancellation request arrives.