Preventing Customer Churn Strategies: 9 Plays for SaaS in 2026
Quick answer
This article provides 9 actionable plays for preventing customer churn in B2B SaaS, organized by five root causes (Poor Fit, Low Engagement, Budget Pressure, Champion Departure, Involuntary Churn). It includes benchmarks, a diagnostic self-assessment, and specific metrics for each play, targeting companies between $500K and $50M ARR.
Quick Answer
Preventing customer churn starts with diagnosing the root cause — not applying generic tactics. The five root causes behind most B2B SaaS churn are Poor Fit, Low Product Engagement, Budget Pressure, Champion Departure, and Involuntary/Failed Payment.
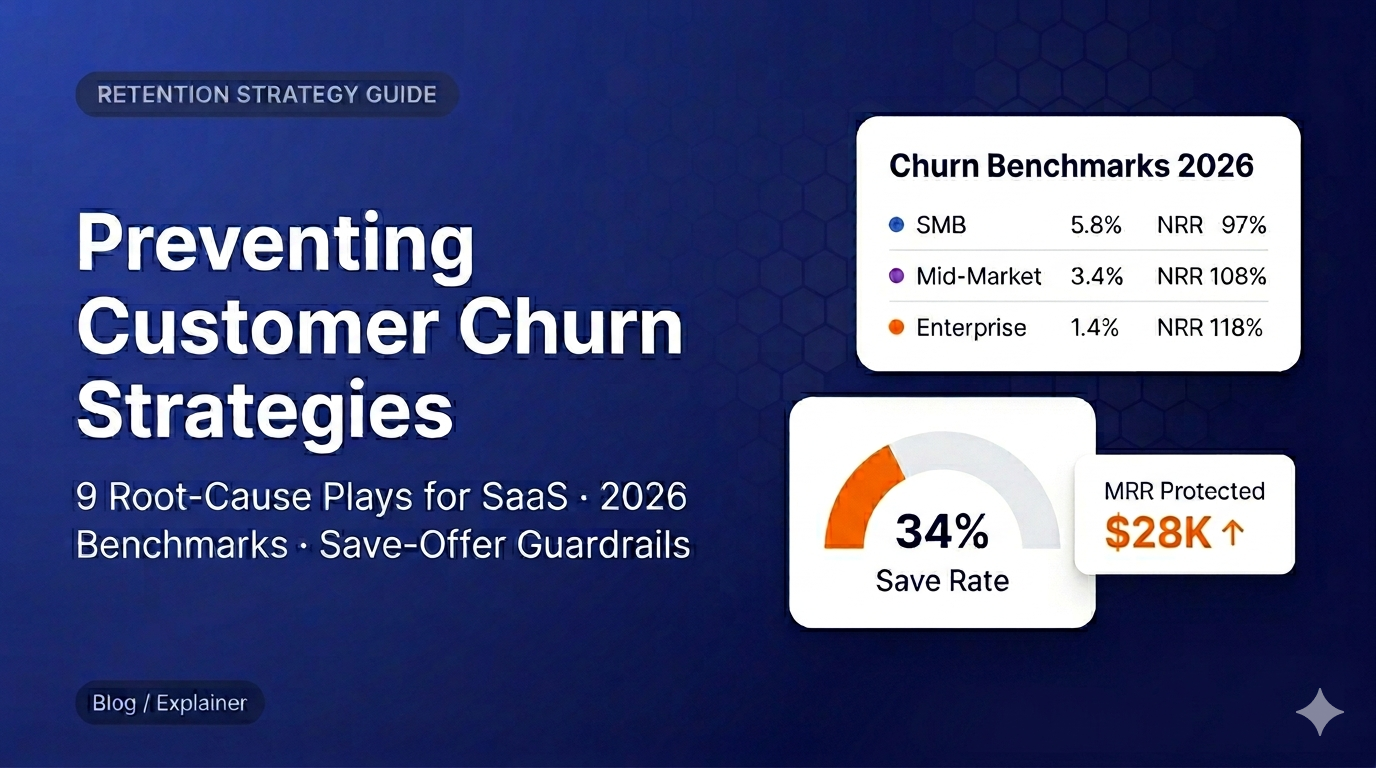
- Healthy churn benchmarks: 3–5% monthly (SMB) · 2–3% (Mid-Market) · <1% (Enterprise)
- Structured cancel flows recover up to 40% of at-risk cancellations
- Strong onboarding cuts 30-day churn from ~18% to under 10%
Every SaaS company leaks revenue. The question is how fast — and whether you have a system to stop it.
The median monthly churn rate across B2B SaaS sits at 4.7% in 2025. For a company at $2M ARR, that figure translates to roughly $94,000 in lost MRR if left unchecked.
Meanwhile, some industry analyses suggest customer acquisition costs have risen significantly over the past eight years, and some industry analyses suggest CAC payback now averages 18 months.
The math is unforgiving: every dollar not spent on retention gets replaced by one that costs significantly more to earn back.
Most content on preventing customer churn strategies stops at generic advice — “improve onboarding,” “listen to customers,” “be proactive.”
That guidance is not wrong. It is just not actionable for a CS Manager or VP of Retention who needs to know which play to run first, for which segment, tied to which metric.
This article takes a different approach. It starts with a diagnosis — mapping churn to one of five root causes — then walks through nine plays built specifically for B2B SaaS companies between $500K and $50M ARR.
Each play names the root cause it addresses, the segment it fits, and the metric it moves.
Is your churn above benchmark for your ARR segment?
Book a free Retention Playbook Review and see which plays will move the needle in 90 days.
What is customer churn in SaaS (and what “good” looks like in 2026)
Customer churn is the percentage of customers — or revenue — lost in a given period. For a deeper look at how to measure it correctly, see our guide to the SaaS churn rate formula. But knowing the formula is only half the work. The more important question is: is your number actually a problem?
The answer depends entirely on your segment. A 4% monthly churn rate is a crisis for an Enterprise-focused product and completely normal for a self-serve SMB tool. Benchmarks without context are noise.
Customer churn vs. revenue churn (MRR churn)
Logo churn counts the number of accounts lost. Revenue churn — or MRR churn — measures the percentage of monthly recurring revenue those accounts represented.
A company can lose many small accounts (high logo churn) while keeping its MRR nearly intact, or lose one large account and take a significant revenue hit with low logo churn.
CFOs and boards focus on MRR churn and Net Revenue Retention (NRR) because those numbers directly reflect business health and valuation multiples.
What is a good churn rate for SaaS in 2026?
The table below shows 2025 benchmark ranges by segment, based on industry data. Use it to benchmark your current numbers before deciding which plays to prioritize.
The answer depends entirely on your segment. A 4% monthly churn rate is a crisis for an Enterprise-focused product and completely normal for a self-serve SMB tool.
Numbers vary significantly by vertical and ARR stage, with Enterprise consistently below 1% and SMB self-serve products running as high as 8–10%. Benchmarks without context are noise.
| Segment | ACV Range | Median Monthly Churn | Healthy Range | Median NRR |
|---|---|---|---|---|
| SMB | < $1K | 5.8% | 3–5% | ~97% |
| Mid-Market | $1K–$25K | 3.4% | 2–3% | ~108% |
| Enterprise | > $25K | 1.4% | < 1% | ~118% |
Sources: industry benchmark data, 2025. NRR figures reflect venture-backed SaaS medians.
How Net Revenue Retention (NRR) reframes churn
NRR measures how much revenue you retain and expand from your existing customer base over a period, net of churn and contraction. An NRR above 100% means your existing customers are growing faster than you are losing others — the engine of efficient SaaS growth.
According to industry data, companies with NRR at or above 100% grow at nearly twice the rate of those below that threshold. For a deeper breakdown of how retention rate is calculated alongside churn, see our customer retention rate formula guide.
Diagnose why customers churn: 5 root causes in B2B SaaS
Before running any retention play, you need to know why customers are leaving. Most teams skip this step and jump straight to tactics — discounts, check-in calls, feature announcements — without understanding whether those tactics address the actual problem.
The result is wasted effort and, in the case of indiscriminate discounting, a retention strategy that actively damages NRR over time.
For a broader framework on how to structure your approach, see our churn reduction strategies guide.
In B2B SaaS, the overwhelming majority of cancellations trace back to one of five root causes. Identifying which one dominates your churn mix is the single most important step before building any playbook.
Voluntary vs. involuntary churn (and why you need both views)
Voluntary churn happens when a customer actively decides to leave — because the product no longer fits, the budget was cut, or a champion moved on. Involuntary churn happens when the account lapses due to a failed payment, with no cancellation intent from the customer.
Industry data shows that SaaS companies without proper dunning automation lose approximately 9% of MRR annually to failed payments alone.
These are two entirely different problems requiring entirely different interventions, and most churn reports that aggregate both are misleading.
The 5 dominant root causes in B2B SaaS
| Root Cause | Key Signals | Where It Shows Up |
|---|---|---|
| Poor Fit / Wrong ICP | Low activation, early cancellations (< 90 days), repeated basic support tickets | CRM, support logs, cohort analysis by acquisition channel |
| Low Product Engagement | Login drop for 2+ weeks, low feature adoption, stalled onboarding milestones | Product analytics, health score, onboarding completion rate |
| Budget Pressure | Price objections at renewal, requests for downgrades, mentions of budget cuts in calls | CRM notes, renewal conversations, exit surveys |
| Champion Departure | Key contact goes silent, LinkedIn job change, new stakeholder not onboarded | CRM, LinkedIn alerts, QBR attendance drops |
| Involuntary / Failed Payment | Card declined, expired credit card, billing contact unresponsive | Billing system, dunning logs, payment failure alerts |
Quick self-assessment: which root cause is driving your churn?
Use the quiz below to identify your dominant root cause. Each question reflects a real signal pattern observed across B2B SaaS retention teams. Your result will map directly to the plays covered in the next section.
Self-Assessment
What is your dominant churn root cause?
Question 1 of 5
Get a Retention Playbook for Your Root Cause →
9 preventing customer churn strategies mapped to root causes
The nine plays below are organized by the root cause they address most directly. Each one names the segment it fits best, the metric it moves, and the early-warning signals that trigger it.
If you completed the self-assessment above, start with the two plays recommended for your dominant root cause — then layer in the others over the following quarter.
For a broader view of how these plays fit into a full retention motion, see our guide on how to reduce churn rate.
Play 1: Fix your onboarding to cut 30–90 day churn in half
Root causes addressed: Low Product Engagement, Poor Fit
Best for: SMB and Mid-Market SaaS, self-serve and low-touch models
Metric target: Reduce 30-day churn from ~18% to under 10%; push 90-day retention above 75%
Onboarding accounts for 30 to 50% of the variance in churn. Completing it cuts 30-day churn nearly in half and increases 90-day retention from the 40–55% range to 75–85%.
Despite those numbers, most SaaS teams treat onboarding as a one-time setup task rather than a structured retention play.
The fix starts with defining two or three activation milestones — the specific actions that correlate with long-term retention in your product — and measuring how many new accounts reach each one within 7, 30, and 90 days.
Users who do not engage within the first 72 hours carry a 90% churn probability. That window is your highest-leverage intervention point.
✅ Onboarding Activation Checklist
- Define 2–3 activation milestones tied to long-term retention data
- Measure 7 / 30 / 90-day activation rates by cohort and acquisition channel
- Trigger an automated intervention for any account not reaching milestone 1 within 72 hours
- Assign a CSM to accounts above your ARPA threshold that stall in week 1
- Run a monthly review of onboarding completion rate vs. 90-day churn by segment
Play 2: Build a predictive health score with real early-warning signals
Root causes addressed: Low Product Engagement, Champion Departure
Best for: Mid-Market and Enterprise, sales-led and CS-led models
Metric target: Identify at-risk accounts 30–45 days before cancellation intent surfaces
A health score is only useful if it reflects signals that actually predict churn in your product — not generic inputs copied from a template.
The most reliable early-warning signals across B2B SaaS are: login frequency drop over two or more consecutive weeks, decline in adoption of two or more core features, unresolved support tickets open for more than 48 hours, NPS drop of 20+ points, and absence of the primary champion from the last two touchpoints.
Weight each signal according to its correlation with actual churn in your cohort data. A simple red/amber/green (RAG) model updated weekly gives CS teams a prioritized action queue without requiring a data science team to maintain it.
Play 3: Segment your churn and focus on the movable middle
Root causes addressed: All five, but prioritizes resource allocation
Best for: Any SaaS company with more than 50 active accounts
Metric target: Concentrate retention effort on the 20–30% of accounts that represent 60–70% of at-risk MRR
Not all churn is worth fighting equally. Accounts that were always a poor fit will churn again even if you save them this cycle. Accounts already committed to a competitor are rarely recoverable.
The highest ROI segment is the “movable middle” — accounts with genuine product value, moderate engagement, and a solvable retention barrier.
Segment your at-risk accounts by ARPA, time in product, engagement score, and root cause signal. Then assign intervention effort accordingly: high-touch for high-ARPA movable accounts, automated sequences for low-ARPA, and a documented decision to let go of clear poor-fit accounts rather than spending CS hours on unwinnable saves.
For a detailed breakdown of retention benchmarks by industry segment, see our average customer retention rate by industry guide.
Play 4: Run a weekly churn prevention review (30 minutes)
Root causes addressed: Low Product Engagement, Champion Departure, Budget Pressure
Best for: CS teams of any size; especially high-impact for teams without a dedicated retention tool
Metric target: Reduce average time-to-intervention from 3–4 weeks to under 7 days
Most churn is not sudden. The signals appear weeks before a cancellation request lands in your inbox.
The problem is that without a structured review cadence, those signals sit in disconnected tools — product analytics, CRM, billing system, support queue — and no one acts on them in time.
A weekly 30-minute review with a fixed agenda changes that dynamic:
📋 Weekly Retention Review — 30-Minute Agenda
- Review risk signals (10 min): pull accounts that turned red or dropped amber this week across health score, billing, and usage
- Assign ownership (5 min): every at-risk account gets a named CSM and a next action within 48 hours
- Log outcomes (5 min): update last week’s interventions — saved, lost, or still in progress
- Spot patterns (10 min): is churn concentrating in a specific cohort, channel, or ARPA band this month?
Play 5: Design ethical cancellation flows that save 20–30% of at-risk MRR
Root causes addressed: Budget Pressure, Low Product Engagement, Poor Fit
Best for: Self-serve and low-touch SaaS with a digital cancellation path
Metric target: Save 20–30% of cancellation sessions; reduce MRR churn by 1–2 percentage points
Structured cancel flows recover 20 to 40% of at-risk cancellations when designed correctly. The key word is “designed” — a cancel flow is not a friction wall that makes it harder to leave.
It is a diagnostic moment: a short survey that identifies the reason for cancellation and branches to the most relevant retention offer based on that reason.
The structure that works:
- Exit survey (2–3 questions maximum): why are you cancelling?
- Branching logic based on the answer: each root cause routes to a different offer
- Tiered save offers in strict hierarchy: pause account → downgrade plan → time-limited discount
- Confirmation step that makes the outcome explicit, whether saved or cancelled
The hierarchy matters. Jumping straight to a discount trains customers to cancel whenever they want a price reduction.
Customers who accept discounts without a genuine budget constraint churn at 3.2 to 3.4 times the rate of organic customers — and reduce your NRR in the process. For a deeper look at how cancel flows and voluntary churn interact, see our guide on how to reduce customer churn.
Play 6: Automate dunning to slash involuntary churn from 9% to under 3%
Root cause addressed: Involuntary / Failed Payment
Best for: Any SaaS with monthly billing and a self-serve or low-touch motion
Metric target: Recover 60–80% of failed payments; reduce involuntary churn below 3% of MRR
Involuntary churn is the most underestimated revenue leak in SaaS. Companies without structured dunning lose approximately 9% of MRR annually to failed payments — not because customers want to leave, but because no one caught the billing failure in time. The good news is that most of it is recoverable.
Effective dunning automation works in three layers. The first is pre-dunning: notifying customers before their card expires, ideally 7 and 3 days in advance.
The second is smart retry logic — spacing payment retries across different days and times rather than attempting the same card repeatedly within hours. The third is a human escalation path for high-ARPA accounts where an automated email is not enough and a direct call from CS will recover the account faster than any retry sequence.
Companies with well-structured dunning automation consistently recover 60 to 80% of failed payments and bring involuntary churn below 3% of MRR — a lift that in many cases adds 8 to 12 percentage points of effective NRR with no product changes required.
Play 7: Build a save-offer framework with guardrails
Root cause addressed: Budget Pressure (genuine constraint vs. price excuse)
Best for: Mid-Market and SMB with a CS-assisted cancellation path
Metric target: Maintain save rate above 25% while protecting NRR and LTV
The most common retention mistake in SaaS is using discounts as the default save offer. It feels like it works — the customer stays — but the data tells a different story.
Customers who accept discounts without a genuine budget constraint churn at 3.2 to 3.4 times the rate of customers who stay at full price. Universal discounts can reduce LTV by more than 30%. You are not retaining customers; you are delaying churn and eroding margins.
The framework that protects both save rate and NRR follows a strict hierarchy:
💡 Save-Offer Hierarchy — Always in This Order
1. Pause
Offer a 1–2 month account pause when the customer is facing a short-term budget or bandwidth constraint. Preserves the relationship and the data.
2. Downgrade
Move the account to a lower tier that fits current usage. Reduces MRR but retains the customer in the product ecosystem and keeps expansion possible.
3. Discount — only with guardrails
Maximum 20% off for one billing cycle. Only when pricing is a verified constraint, not an excuse. Maximum one save offer per account per 12 months.
Diagnose before you offer. A customer citing price who has low engagement is not a budget problem — it is a value problem.
The diagnostic step before any offer is non-negotiable. A customer citing price as the reason for cancellation who shows low product engagement is not experiencing budget pressure — they are experiencing a value gap.
Offering a discount in that scenario saves the account for one billing cycle and guarantees a second cancellation request within 90 days.
Play 8: Run retention-led account reviews for high-ARPA customers
Root causes addressed: Champion Departure, Budget Pressure, Low Product Engagement
Best for: Mid-Market and Enterprise, sales-led and CS-led models with ACV above $5K
Metric target: Reduce churn among top 20% accounts by ARPA; increase expansion MRR from existing base
For high-ARPA accounts, churn rarely arrives without warning — it arrives without the right person noticing. The most common failure pattern is a quarterly business review (QBR) that focuses on product roadmap and feature updates rather than the customer’s business outcomes.
When the champion leaves, or when budget pressure emerges, a relationship built on roadmap conversations has no resilience.
Retention-led account reviews shift the agenda to three questions: what outcomes has the customer achieved since the last review, where are the gaps between expected and actual value, and which stakeholders beyond the primary champion are engaged with the product.
Multi-threading — building relationships with two or more decision-makers in the account — is the single most effective hedge against Champion Departure churn. A single-threaded account where your only contact changes jobs is a churn event waiting for a calendar date.
Play 9: Align acquisition with retention — fix the leaky bucket at the source
Root causes addressed: Poor Fit / Wrong ICP
Best for: Any SaaS company where early churn (under 90 days) represents more than 25% of total logo churn
Metric target: Reduce early churn by 40–50%; improve average LTV by tightening ICP definition
No retention play compensates for acquiring the wrong customers at scale. If your churn is concentrated in the first 90 days, in accounts from a specific channel, vertical, or company size range, the fix is not in CS — it is in how your ICP is defined and enforced upstream.
Run a cohort analysis that cross-references churn timing and reason against acquisition channel, company size, vertical, and ARPA. The pattern will almost always reveal one or two acquisition sources generating disproportionate early churn.
Feeding that data back to marketing and sales — with a clear profile of which accounts retain and expand vs. which ones churn fast — is the highest-leverage retention intervention available. Every wrong-fit customer you stop acquiring is a cancellation you never have to fight.
For a structured view of how retention strategy connects to acquisition alignment, see our customer retention strategy for SaaS guide.
Want these 9 plays mapped to your own churn data?
Book a free Retention Playbook Review — we’ll map your root cause, segment and next plays in one session.
The economics: CAC, retention and NRR (why your board cares)
Preventing customer churn is not just a CS priority — it is a unit economics argument. Understanding the financial case makes it easier to secure budget, headcount, and executive attention for retention initiatives that otherwise compete with acquisition spend for resources.
The CAC problem reframes every retention decision
Customer acquisition costs in SaaS have risen approximately 222% over the past eight years. CAC payback now averages 18 months — meaning the average customer does not become profitable until well into their second year.
In that context, a customer who churns at month 10 never paid back their acquisition cost. Every percentage point of churn you reduce is not just revenue saved; it is acquisition spend that is no longer being wasted.
Research from Bain & Company and Harvard Business Review has long established that acquiring a new customer costs five to twenty-five times more than retaining an existing one, and that a 5% increase in retention can lift profits between 25% and 95% depending on margin structure. Those numbers have only become more relevant as CAC has continued to rise.
NRR is the metric that connects retention to valuation
Net Revenue Retention is the number that translates your retention performance into language that investors and boards understand immediately.
An NRR above 100% means your existing customer base is growing — through expansion, upsell, and low churn — faster than you are losing revenue to cancellations and contractions.
The NRR growth multiplier
- Companies with NRR ≥ 100% grow at nearly 2× the rate of those below that threshold
- Reducing churn from 3% to 1.5% monthly can double customer LTV at a modest ARPA
- Each point of MRR churn eliminated shortens CAC payback and compounds across the entire customer base
- leading Mid-Market SaaS targets NRR above 120%; Enterprise above 130%
The practical implication is straightforward: a retention investment that costs $5K per month in CS headcount or tooling and saves $20K in MRR churn generates a 4× ROI before a single new customer is acquired.
That is the framing your board responds to — and the reason the nine plays in this article are worth prioritising before the next demand generation campaign.
Turning strategies into a retention operating system
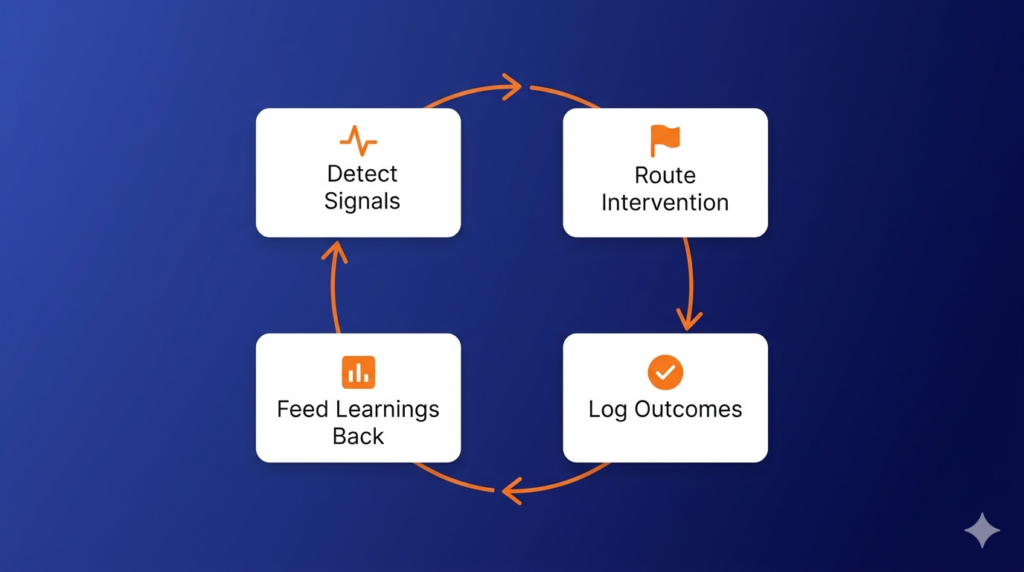
The nine plays above are not a checklist to complete once. They are components of a system that runs continuously — detecting signals, routing interventions, logging outcomes, and feeding learnings back into acquisition and product decisions.
The difference between SaaS teams that consistently hit NRR above 100% and those that spend every quarter firefighting churn is rarely a lack of tactics. It is the absence of a repeatable operating rhythm that connects signals to action before it is too late.
From ad-hoc firefighting to a weekly retention routine
The shift from reactive to proactive retention does not require a large team or a complex tool stack. It requires three things: a shared definition of what “at-risk” looks like in your product, a weekly moment where someone reviews the list and assigns ownership, and a documented playbook that tells each CSM what to do based on the root cause signal they are seeing.
Teams using a structured retention dashboard — like the one inside ChurnDefense — reduce time-to-insight significantly by pulling health score, MRR churn, NRR, and cancel flow data into a single view segmented by ARPA and customer tier.
That visibility is what makes the weekly review actionable rather than a conversation about incomplete data.
Where tools fit in your retention stack
Most churn problems are not tool problems — they are process problems that a tool can accelerate once the process exists.
Before evaluating any retention platform, confirm you have three foundations in place: a defined health score with signals weighted to your actual churn data, a cancel flow with branching logic and tiered save offers, and a weekly review cadence with named ownership per account.
Once those foundations exist, the right tooling connects your product analytics, CRM, and billing data into a single retention view — alerting CSMs to at-risk accounts, orchestrating cancel flows with save-offer guardrails, and tracking NRR and logo churn by segment over time.
That is the operational layer that turns the nine plays in this article from theory into a measurable retention motion.
See your churn map in a live Retention Playbook Review
Free session. No commitment. Walk away with a clear view of your dominant root cause and the two plays that will move your NRR fastest.