Customer Retention Management Features: The 12 Must-Haves for SaaS Teams
Quick answer
Customer retention management features are platform capabilities that identify at-risk customers, automate retention workflows, and measure churn reduction. The 12 must-haves include health scoring, risk alerts, automated playbooks, segmentation, cohort analysis, engagement tracking, activity timelines, CS workflows, exit surveys, retention dashboards, integrations, and predictive churn models. These features transform reactive firefighting into proactive retention systems that reduce churn before it happens.
Quick Answer
Customer retention management features are platform capabilities that identify at-risk customers, automate retention workflows, and measure churn reduction. The 12 must-haves include health scoring, risk alerts, automated playbooks, segmentation, cohort analysis, engagement tracking, activity timelines, CS workflows, exit surveys, retention dashboards, integrations, and predictive churn models. These features transform reactive firefighting into proactive retention systems that reduce churn before it happens.
`
Customer retention determines whether a SaaS business scales profitably or burns capital replacing churned accounts. Most teams know they need retention tools, but few understand which customer retention management features actually reduce churn versus which create dashboard clutter without impact.
The average SaaS company uses 3-5 different tools to track customer health, send alerts, and manage retention workflows. This fragmentation creates blind spots where at-risk customers fall through cracks between systems.
Choosing the right retention management platform requires understanding which features deliver ROI and which are nice-to-have distractions. This guide breaks down the 12 must-have customer retention management features that separate effective retention systems from expensive noise.
For a complete overview of building retention systems from scratch, see our customer retention strategy for SaaS guidee
It also covers common pitfalls when evaluating platforms, implementation best practices, and how to measure whether your retention features actually reduce churn.
What Are Customer Retention Management Features?
Customer retention management features are specific capabilities within platforms designed to identify churn risks, automate retention interventions, and measure the effectiveness of retention efforts. These features transform scattered customer data into actionable insights that prevent cancellations before they occur.
Unlike basic analytics dashboards that only report what happened, retention management features enable proactive intervention through automated alerts, workflow triggers, and predictive models. They connect customer behavior signals—product usage drops, support ticket spikes, billing issues—to retention playbooks that customer success teams execute systematically.
The distinction matters because many SaaS companies confuse retention management features with general customer success platforms or basic CRM functionality. True retention features focus specifically on churn prediction and prevention, not just account management or upsell tracking.
They answer the question: “Which customers will churn next month, and what should we do about it?”
These features execute the tactical layer of your broader customer retention strategy.
Real Example: Feature vs. Reporting
❌ Basic Analytics:
“Account XYZ hasn’t logged in for 14 days” (passive observation)
✓ Retention Management Feature:
“Account XYZ flagged as 85% churn risk → trigger re-engagement playbook → assign to CSM Sarah → send usage tips email sequence → schedule check-in call”
Retention features combine detection, automation, and orchestration to prevent churn systematically.
Why Customer Retention Management Features Matter
Customer retention management features directly impact the bottom line by reducing churn rate, which compounds monthly. A SaaS business that reduces churn from 5% to 3% monthly retains a significantly higher percentage of customers after 12 months.
That’s a 24-percentage-point difference that translates to millions in preserved revenue for growing companies.
Traditional reactive retention approaches fail because customer success teams discover churn risks too late. By the time a customer submits a cancellation request, the decision has often solidified over weeks or months of declining engagement.
Retention features shift intervention upstream by detecting early warning signals—usage drops, support frustration, billing disputes—when customers remain saveable.
The ROI calculation is straightforward. If retention features help save just 10 additional customers per month averaging $500 MRR each, that’s $5,000 monthly recurring revenue preserved.
Over 12 months, those saves compound to $60,000 in prevented annual revenue loss, not counting the LTV of those retained customers who may stay for years.
Proactive retention systems also improve customer success team efficiency. Instead of reactive firefighting based on gut feel about which accounts need attention, retention features prioritize interventions based on data-driven risk scores.
This allows CS teams to focus time on high-value accounts with actual churn risk rather than wasting hours on healthy customers who weren’t going anywhere.
Key Benefits
- – Reduce churn 20-40% through early detection and automated intervention
- – Improve CS efficiency by prioritizing time on truly at-risk accounts
- – Shift from reactive to proactive retention with upstream signal detection
- – Preserve revenue at scale without proportional headcount increases
The 12 Must-Have Customer Retention Management Features
Effective retention platforms combine multiple features that work together as a system. Each feature serves a specific purpose in the retention workflow—from detection to intervention to measurement.
These 12 capabilities represent the minimum viable feature set for reducing churn systematically rather than reactively.
🎯 Feature Priority Calculator
Select your business stage to see which features to prioritize
1. Customer Health Scoring
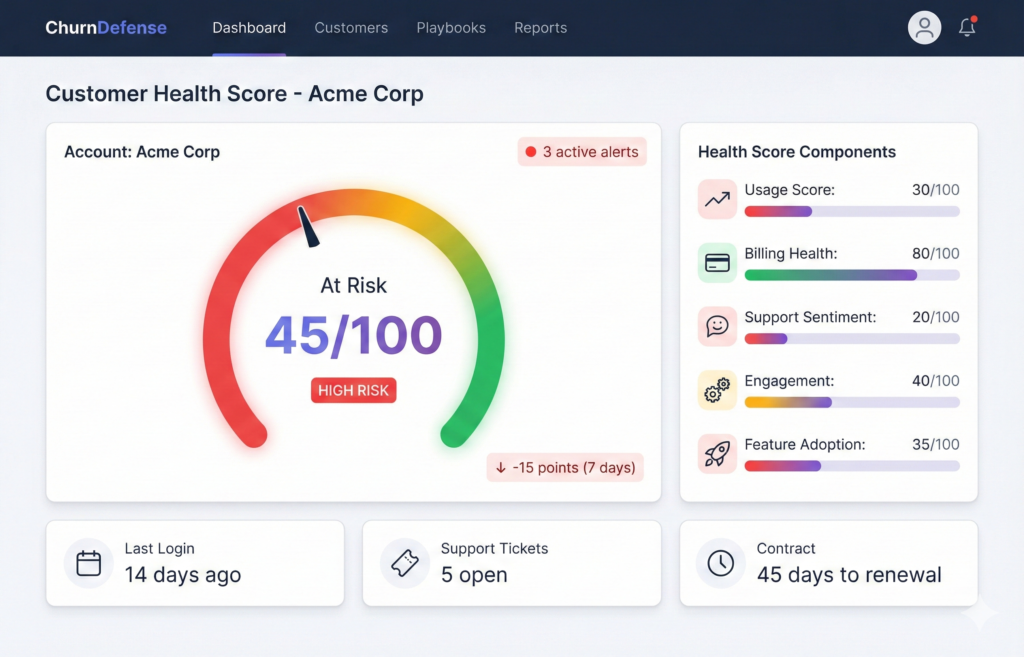
Customer health scoring aggregates multiple signals—product usage, billing status, support interactions, NPS responses—into a single composite metric that indicates overall account health. This score updates continuously as customer behavior changes, providing a real-time view of retention risk across the entire customer base.
The value of health scoring lies in standardization and objectivity. Instead of CS teams relying on gut feel about which accounts need attention, health scores create a consistent framework for risk assessment.
A score of 35/100 triggers specific interventions regardless of which CSM owns the account, eliminating the variability that comes from subjective judgment.
Effective health scores balance lagging indicators (payment issues, contract approaching renewal) with leading indicators (feature adoption, login frequency, API calls). This combination catches both immediate risks and early warning signals that predict churn months before cancellation.
Without health scoring, retention efforts lack the systematic prioritization that separates high-performing CS teams from those constantly firefighting.
Industry-standard health scoring frameworks typically combine 5-10 signals across usage, support, and billing.
2. Churn Risk Alerts & Notifications
Automated churn risk alerts notify CS teams immediately when customer behavior crosses critical thresholds that predict elevated cancellation probability. These alerts fire based on specific triggers—health score drops below 40, no login for 14 days, support ticket marked “urgent,” failed payment on file.
They ensure teams learn about risks in real-time rather than through weekly dashboard reviews.
Alert systems matter because timing determines save rates. A customer who stopped logging in 3 days ago remains reachable through proactive outreach.
The same customer after 30 days of absence has likely already mentally churned and begun evaluating alternatives. Real-time alerts compress the intervention window to maximize retention probability.
The best alert systems route notifications to the right person based on account ownership, severity, and workload balance. High-value enterprise accounts trigger immediate Slack messages to dedicated CSMs.
Lower-tier accounts might queue for pooled CSM review. This intelligent routing prevents alert fatigue while ensuring critical risks never get missed in notification overload.
3. Automated Retention Playbooks
Automated retention playbooks define step-by-step intervention workflows that execute when specific churn risk conditions occur. When a customer meets playbook trigger criteria—health score drops 20 points in one week, billing fails twice, usage falls below activation threshold—the platform automatically sends email sequences, creates CS tasks, schedules calls, and updates account status.
All without manual intervention.
Playbook automation matters because it eliminates the inconsistency that comes from manual retention processes. Different CSMs handle at-risk accounts differently based on experience and workload.
Playbooks codify best practices into repeatable workflows that every account receives consistently, regardless of which team member happens to notice the risk signal.
Effective playbooks balance automation with human touchpoints. Fully automated email sequences work for low-touch segments and early-stage interventions.
High-value accounts trigger automated task creation that prompts CSMs to make personal calls. This hybrid approach scales retention efforts across thousands of accounts while preserving the human connection that enterprise customers expect.
4. Segmentation by Behavior & Attributes
Customer segmentation organizes accounts into groups based on shared characteristics—ARPA tier, industry vertical, product usage patterns, contract type, tenure, geographic region. This enables targeted retention strategies that match segment-specific churn drivers.
Retention playbooks that work for SMB customers on monthly plans often fail for enterprise accounts on annual contracts because churn motivations differ fundamentally.
Segmentation reveals patterns invisible in aggregate metrics. A 5% overall churn rate might hide 12% churn among customers in the hospitality vertical experiencing seasonal downturns while financial services customers churn at only 2%.
Segment-level analysis identifies which cohorts require urgent intervention versus which maintain healthy retention despite company-wide averages suggesting problems.
Behavioral segmentation goes beyond demographic attributes to group customers by how they use the product. Power users who adopted 8+ features behave differently than casual users who only engaged with core functionality.
These usage-based segments often predict retention better than firmographic data, because product engagement directly drives perceived value that determines renewal decisions.
5. Cohort Analysis & Retention Curves
Cohort analysis tracks retention rates for customer groups acquired in the same time period, revealing whether retention improves for recent cohorts or degrades across the board. Retention curves visualize month-over-month survival rates for each cohort.
This makes it immediately obvious whether product improvements and CS process changes actually reduce churn for new customers.
Cohort retention curves expose the impact of changes invisible in aggregate churn metrics. If January cohort retention at month 6 equals 85% while June cohort retention at month 6 equals 78%, something degraded between those periods.
Perhaps onboarding quality slipped, or a product bug introduced friction. Without cohort analysis, these patterns remain hidden behind company-wide averages.
Retention curves also establish realistic retention expectations based on customer age. Most SaaS products experience elevated churn in months 1-3 before retention stabilizes.
Cohort curves quantify this pattern, helping CS teams distinguish between normal early-stage churn and concerning degradation. This prevents panic over expected attrition while highlighting genuine retention problems that require immediate attention.
According to venture capital benchmarks, companies with improving cohort retention curves command 2-3x higher valuations.
Basic vs. Advanced Retention Features
Understanding which features drive retention vs. nice-to-have capabilities
| Feature Category | Basic (Must-Have) | Advanced (Nice-to-Have) |
|---|---|---|
| Health Scoring | Manual score based on 3-5 signals | AI-weighted score with 15+ signals |
| Alerts | Email alerts for critical events | Multi-channel alerts (Slack, SMS, in-app) |
| Playbooks | Basic email sequences | Multi-step workflows with conditions |
| Segmentation | ARPA tiers and plan types | Behavioral + predictive segments |
| Reporting | Monthly churn dashboards | Real-time cohort analysis |
| Prediction | Rule-based risk flags | ML models trained on your data |
`
💡 Start with basic features and add advanced capabilities as retention process matures
6. In-App Engagement Tracking
In-app engagement tracking monitors how customers interact with product features—which screens they visit, how often they perform key actions, which workflows they complete, where they encounter friction. This behavioral data powers health scores, triggers retention playbooks, and reveals whether customers achieve value from the product beyond just paying for access.
Engagement metrics predict churn more accurately than demographic attributes because they measure actual product usage rather than firmographic proxies. A customer who logs in daily and uses 5+ features faces low churn risk regardless of company size.
Conversely, a large enterprise account that only logs in monthly for basic reporting shows elevated risk despite appearing healthy based on contract value alone.
Tracking specific feature adoption reveals expansion opportunities disguised as retention risks. A customer who achieved success with one product module but never discovered complementary features represents both a churn risk (low breadth of usage reduces switching costs) and an upsell opportunity.
Successful customers often adopt additional capabilities when properly introduced. Engagement data exposes these patterns that invoice analysis misses completely.
7. Account Timeline & Activity Feed
Account timelines aggregate all customer interactions—support tickets, product usage events, email opens, call notes, contract changes, NPS responses—into a chronological feed. CS teams review this before customer conversations.
This context prevents awkward situations where CSMs unknowingly reference outdated information or miss critical recent developments that changed account dynamics.
Activity feeds matter because customer success requires understanding the full relationship history, not just recent snapshots. A health score drop from 75 to 45 looks different when the timeline shows a frustrated support escalation versus a temporary usage dip during the customer’s fiscal year-end.
Context determines appropriate intervention strategy.
The best timeline features surface relevant events automatically rather than requiring manual digging through multiple systems. When a CSM opens an account, the platform highlights recent support tickets, usage anomalies, and engagement drops.
No navigation across CRM, support desk, and analytics tools required. This consolidation saves time and ensures retention conversations happen with complete context about customer sentiment and behavior.
8. Customer Success Workflow Automation
CS workflow automation creates tasks, assigns owners, sets due dates, and tracks completion status when retention playbooks trigger. When an account crosses into at-risk status, the platform automatically creates a CSM task “Schedule health check call within 48 hours.”
This beats hoping someone notices the risk signal during weekly account reviews.
Automated workflows prevent tasks from falling through cracks when CS teams manage hundreds of accounts simultaneously. Manual task creation depends on individual CSM diligence and memory, which breaks down under workload pressure.
Automated task generation ensures every at-risk account receives defined interventions regardless of how busy the team becomes during renewal season.
Workflow tracking also enables retention process measurement. If 80% of generated tasks remain incomplete past due date, the CS team faces bandwidth constraints that require additional headcount or workload rebalancing.
This visibility into process execution quality helps retention leaders identify where systematic failures occur versus where isolated account issues drive churn.
Want to see these features in action?
ChurnDefense includes all 12 must-have retention management features: health scores, automated playbooks, churn prediction, and real-time alerts to stop churn before it happens.
9. Churn Survey & Exit Feedback
Churn surveys collect structured feedback from canceling customers to understand why they decided to leave, what alternatives they chose, and what might have changed their decision. This qualitative data complements quantitative churn metrics by revealing the actual reasons customers leave versus proxy signals that correlate with churn.
Exit feedback exposes gaps between internal assumptions about churn drivers and customer reality. A company might assume pricing drives churn when surveys reveal poor onboarding as the primary complaint.
Without direct customer feedback, retention efforts focus on discounts when improved activation would reduce churn more effectively.
The best churn survey features integrate into cancellation flows rather than requiring separate email outreach after customers already left. In-flow surveys capture feedback when cancellation reasons remain top-of-mind, improving response rates and data quality.
Post-cancellation surveys sent days later suffer low completion rates as former customers mentally move on to replacement solutions.
10. Retention Dashboard & Reporting
Retention dashboards consolidate key metrics—churn rate by segment, cohort retention curves, at-risk account counts, save rates from interventions, leading indicators trending—into executive-friendly views. These dashboards track whether retention initiatives produce measurable improvement.
They update in real-time rather than requiring manual data pulls for monthly business reviews.
Dashboard reporting matters because what gets measured gets managed. Without clear visibility into retention metrics broken down by segment, CS teams lack the data to identify which customer cohorts require intervention versus which maintain healthy retention.
Dashboards expose these patterns immediately rather than hiding them in spreadsheet exports.
Effective retention dashboards separate lagging indicators (actual churn) from leading indicators (health score distribution, at-risk account pipeline). This distinction helps teams shift focus from reporting what already happened to preventing what might happen next.
A dashboard showing 200 accounts at high churn risk creates urgency that historical churn reports cannot match.
11. Integration with CRM, Billing & Support
Platform integrations connect retention management features to systems where customer interaction data lives—CRM for relationship notes, billing systems for payment health, support desks for satisfaction signals. These integrations eliminate manual data entry and ensure health scores reflect complete customer information.
Not just product usage.
Integration matters because retention signals exist across multiple systems that few platforms consolidate natively. A customer might show healthy product usage while simultaneously submitting frustrated support tickets and experiencing payment failures.
Without integration, CS teams see only partial pictures that miss critical risk signals hiding in adjacent systems.
The depth of integration determines feature effectiveness. Surface-level integrations that sync data once daily lag behind real-time customer behavior.
Deep integrations that trigger immediate alerts when support tickets escalate or payments fail enable timely interventions. These happen during narrow windows when customers remain saveable before frustration hardens into cancellation decisions.
Follow billing integration best practices to detect payment failures before they cause involuntary churn
12. Predictive Churn Models (AI/ML)
Predictive churn models use machine learning algorithms trained on historical customer behavior to identify patterns that precede cancellation. These models assign churn probability scores based on hundreds of signals simultaneously—login frequency trends, feature adoption velocity, support sentiment, billing patterns.
They achieve prediction accuracy that manual health scores cannot match.
AI-powered prediction matters because humans struggle to weight multiple signals consistently. A CSM might over-index on recent support tickets while missing gradual usage decline that better predicts churn.
Machine learning models optimize signal weights based on actual churn outcomes, discovering non-obvious patterns that subjective scoring misses.
The value of predictive models increases with data volume. Early-stage companies with limited churn history achieve better results from rule-based health scores.
Mature companies with thousands of churned accounts can train models that detect subtle behavioral patterns invisible to human analysts. This makes predictive churn features valuable for scale but unnecessary for startups still establishing baseline retention processes.
Research on predictive models for churn demonstrates 40-60% accuracy improvements over rule-based scoring.
12-Feature Checklist
- ✓ Customer health scoring
- ✓ Churn risk alerts
- ✓ Automated playbooks
- ✓ Behavior segmentation
- ✓ Cohort analysis
- ✓ Engagement tracking
- ✓ Activity timelines
- ✓ CS workflows
- ✓ Exit surveys
- ✓ Retention dashboards
- ✓ CRM/billing integrations
- ✓ Predictive AI models
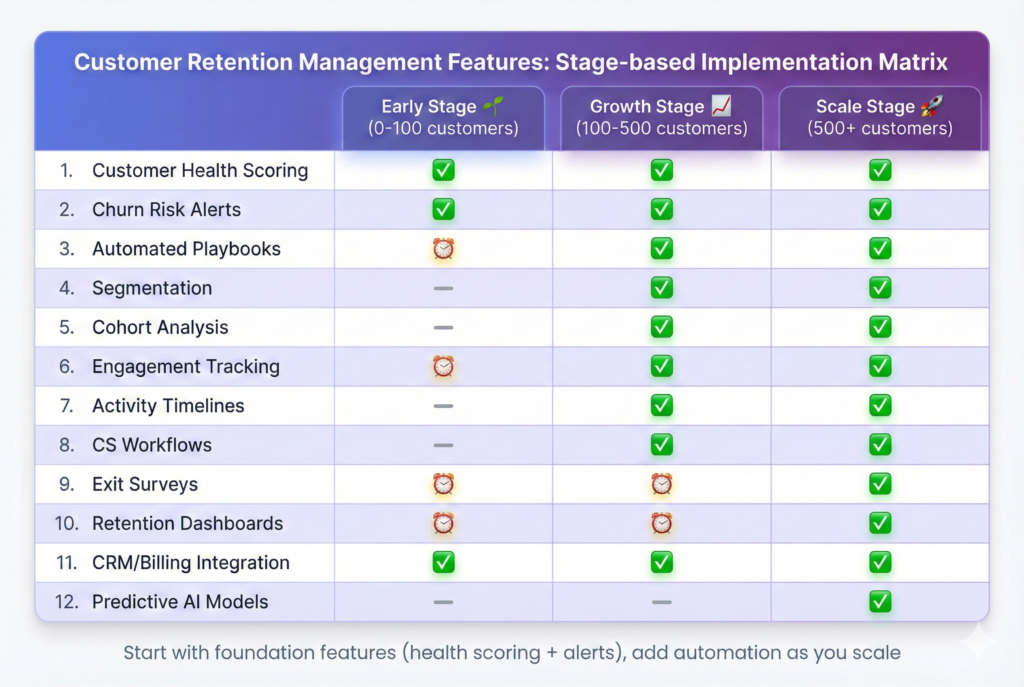
Priority order: Start with features 1-7 (core detection), add 8-10 (automation), then 11-12 (advanced) as retention process matures.
Common Pitfalls When Choosing Retention Software
Evaluating customer retention management platforms requires avoiding common mistakes that lead to poor feature adoption and failed retention initiatives. These pitfalls create situations where companies invest in sophisticated tools that ultimately deliver no measurable churn reduction.
This happens because foundational requirements go unmet.
Choosing features over integration
Many teams prioritize impressive feature lists while ignoring integration requirements that make those features functional. A sophisticated churn prediction model means nothing if it cannot access billing data to detect payment failures or CRM notes to incorporate CS sentiment.
Fragmented data across disconnected systems produces incomplete health scores that miss critical risk signals.
Ignoring data quality requirements
Retention features depend on clean, consistent customer data to generate accurate insights. Companies with messy account hierarchies, duplicate customer records, inconsistent product usage tracking, or unreliable support ticket tagging discover problems.
Health scores and predictions reflect data problems rather than actual churn risk. Platforms cannot fix upstream data quality issues through feature sophistication alone.
Over-relying on automated playbooks
Automation improves retention efficiency but cannot replace human judgment for complex accounts. Enterprise customers facing genuine product limitations require strategic conversations about roadmap alignment, not automated email sequences suggesting knowledge base articles.
Over-automation trains customers to ignore retention outreach as impersonal spam rather than valuable support.
Not defining success metrics upfront
Teams that deploy retention platforms without establishing baseline churn rates, target reduction goals, and measurement frameworks struggle to determine whether features deliver ROI. Without clear success criteria, every feature appears valuable and nothing gets prioritized.
This leads to overwhelming dashboards full of unused capabilities that CS teams ignore in favor of familiar manual processes.
Buying before team readiness
Retention platforms require organizational commitment to systematic customer success processes. Companies where CS teams lack clear account ownership, skip regular risk reviews, and resist structured workflows discover that sophisticated features sit unused.
The team lacks capacity or willingness to change existing habits. Technology cannot force process discipline that organizations resist culturally.
Before evaluating platforms, ensure you have a clear retention strategy framework that defines your churn reduction goals and success metrics.
How to Implement Retention Management Features
Successful retention feature implementation follows a phased approach that builds capability progressively rather than attempting comprehensive deployment. Overwhelming teams and diluted focus fail.
This four-step framework establishes foundations before adding complexity, ensuring each capability layer delivers measurable value before moving forward.
Step 1: Audit Current Retention Data & Processes
Begin by mapping all systems where customer retention signals currently exist—product analytics, billing platforms, CRM, support desk, NPS surveys. Document what data each system captures.
Identify gaps where critical signals go unmeasured, such as feature adoption depth or time-to-value metrics that predict retention but lack instrumentation.
Document current retention workflows even when informal and inconsistent. How do CS teams currently identify at-risk accounts? What triggers outreach attempts?
Who owns retention for different customer segments? This baseline assessment reveals which existing processes can translate into automated playbooks versus which require redesign before platform deployment.
Establish current churn rate by segment as the baseline for measuring improvement. Calculate churn for different ARPA tiers, contract types, industry verticals, and tenure cohorts.
These segment-level baselines prevent the mistake of celebrating overall churn reduction when improvements in one segment mask degradation elsewhere.
Step 2: Define Customer Health Model & Thresholds
Design the initial health score model by selecting 5-7 signals that historical data analysis shows correlate with churn outcomes. Common starting signals include login frequency, feature breadth (number of capabilities used), support ticket volume, payment status, and contract approaching renewal.
Weight these signals based on correlation strength with actual churn rather than gut feeling.
Establish threshold definitions for health score ranges that trigger different intervention tiers. A common framework uses: 80-100 (healthy, no intervention), 60-79 (monitor, automated check-ins), 40-59 (at-risk, CSM task created), 0-39 (critical, immediate escalation).
These thresholds should align with CS team capacity to avoid overwhelming resources with excessive critical alerts.
Start with simple rule-based scoring before attempting machine learning predictions. Rule-based models remain interpretable, debuggable, and quick to deploy.
They provide immediate value while generating the intervention outcome data that ML models require for training. Companies can always add predictive sophistication later after baseline systems prove their value.
Step 3: Configure Alerts & Automation Rules
Define specific trigger conditions for each retention playbook based on customer segments. Example: Enterprise accounts (ARPA >$1K) with health score drop of 15+ points in 7 days trigger immediate CSM task assignment plus Slack notification.
SMB accounts (ARPA <$200) with 30-day login absence trigger automated re-engagement email sequence.
Configure alert routing that balances immediacy with avoiding notification overload. Critical alerts for high-value accounts should fire immediately via multiple channels.
Lower-severity alerts can queue for daily digest review. Test alert volume with small customer samples before full deployment to prevent overwhelming CS teams with action items they cannot reasonably address.
Build 2-3 simple playbooks initially rather than attempting comprehensive coverage. Focus on highest-impact scenarios: onboarding activation (first 30 days), usage drop detection (established customers), and renewal approach (60 days before contract end).
These three playbooks address majority of retention leverage points without creating complexity that delays deployment.
Step 4: Train CS Team & Establish Governance
Conduct hands-on training where CS team members practice using retention features with real account data rather than abstract platform tours. Walk through scenarios: “Health score just dropped to 35 for this account—what does the timeline show, which playbook should trigger, what action do you take?”
Scenario-based training builds muscle memory that generic feature overviews miss.
Establish governance processes for maintaining health score accuracy as business evolves. Assign ownership for quarterly reviews of signal weights, threshold effectiveness, and playbook performance.
Without active governance, initial configurations drift from relevance as product changes, customer base shifts, or competitive dynamics evolve.
Create feedback loops where CS teams report false positives (alerts for accounts that weren’t actually at risk) and false negatives (churned accounts that never triggered alerts). Use this qualitative feedback to refine health score models and alert thresholds continuously.
Retention features improve through iteration based on real-world performance, not just initial best-guess configuration.
Implementation Checklist
- □ Audit current data sources and document retention signal availability
- □ Establish baseline churn rates by segment for comparison
- □ Design health score model with 5-7 signals and clear weights
- □ Define alert thresholds that match CS team intervention capacity
- □ Build 2-3 initial playbooks for highest-impact scenarios
- □ Train CS team with scenario-based practice on real accounts
- □ Establish governance process for quarterly model reviews and updates
📅 30-60-90 Day Implementation Roadmap
Days 0-30: Foundation
- Complete data audit & integrations
- Build health score model (5-7 signals)
- Configure basic alerts (email only)
- Train CS team on platform basics
Days 31-60: Automation
- Deploy 3 automated playbooks
- Add Slack/SMS alert channels
- Implement segmentation (ARPA + usage)
- Launch cohort analysis tracking
Days 61-90: Optimization
- Measure baseline save rates
- Refine health score weights based on outcomes
- A/B test playbook variants
- Evaluate predictive churn model readiness
⚡ Quick wins in 30 days • Full automation in 60 days • Measurable ROI in 90 days
Measuring Success with Retention Features
Effective measurement tracks both outcome metrics (did churn decrease?) and process metrics (are teams actually using retention features?). Outcome-only measurement misses whether poor results stem from ineffective features versus low adoption.
Process-only tracking celebrates activity without confirming business impact.
Churn Rate Reduction (Before/After)
Track churn rate changes for cohorts before and after retention feature deployment. Compare churn at month 6 for customers acquired 3 months before platform launch versus 3 months after.
This cohort-controlled comparison isolates retention feature impact from seasonal variations or market shifts affecting all customers simultaneously.
Segment churn rate measurement by customer tiers to ensure improvements occur across the board rather than in cherry-picked segments. A retention platform that reduces enterprise churn by 30% while SMB churn increases by 15% might deliver negative overall revenue impact.
This happens if SMB customer volume exceeds enterprise accounts. Segment-level tracking prevents misleading aggregate metrics.
Establish realistic reduction targets based on current churn rates and retention maturity. Early-stage retention programs should target 20-30% relative churn reduction (5% to 3.5% monthly churn).
Mature programs with existing retention processes might achieve 10-15% incremental improvement. Unrealistic targets create false failure perceptions when features deliver solid but not miraculous results.
Ensure you’re calculating churn correctly using the SaaS churn rate formula before measuring improvement.
Time-to-Intervention (Alert → Action)
Measure elapsed time between alert firing and CS team taking first retention action. Median time-to-intervention reveals whether alerts create urgency that prompts immediate response or get buried in task queues.
leading CS teams maintain sub-24-hour intervention times for critical alerts.
Track intervention completion rates to identify bottlenecks where alerts trigger but never result in customer outreach. Low completion rates signal either excessive alert volume overwhelming team capacity or alert fatigue from too many false positives.
Both require configuration adjustment to restore alert credibility and action rates.
Correlate intervention timing with save rates to quantify the value of speed. If customers contacted within 24 hours of risk signal save at 40% rates while those contacted after 7 days save at 15%, the urgency case for faster intervention becomes quantifiable.
This data justifies process changes or staffing additions that improve response times.
Save Rate (% of At-Risk Customers Retained)
Calculate save rate as the percentage of customers flagged as at-risk who ultimately renew or remain active rather than churning. Track save rates separately by risk severity (critical vs. moderate) and intervention type (automated email vs. CSM call).
This reveals which retention tactics deliver highest success rates for different churn risk profiles.
Benchmark save rates against industry standards to contextualize performance. Typical SaaS save rates range from 15-25% for customers who reach final cancellation flows to 40-60% for customers intercepted earlier in churn progression.
Save rates below these ranges suggest either late intervention timing or ineffective retention tactics requiring playbook redesign.
Monitor save rate trends over time rather than fixating on absolute numbers. Improving save rates from 20% to 30% over 6 months demonstrates learning and process refinement even when absolute performance remains below leading benchmarks.
Stagnant or declining save rates signal the need for playbook experimentation or deeper churn root cause analysis.
CS Team Efficiency (Accounts Per CSM)
Track account-to-CSM ratios before and after retention feature deployment to measure productivity gains from automation. Effective retention platforms enable CSMs to manage 30-50% more accounts at the same quality level.
Automation handles routine monitoring, risk detection, and low-touch interventions that previously consumed manual effort.
Measure CSM time allocation changes to confirm automation truly frees capacity rather than just creating busywork. If CSMs previously spent 40% of time manually reviewing accounts for risks and now spend 50% responding to automated alerts, the platform added overhead rather than efficiency.
Track hours spent on high-value activities like strategic account planning and relationship building.
Monitor CS team satisfaction alongside productivity metrics to prevent optimization that burns out teams. Efficiency gains from managing more accounts become pyrrhic if quality of life declines and turnover increases.
Balance automation benefits with workload sustainability to achieve long-term retention team performance rather than short-term metric gaming.
According to SaaS benchmark data, top-quartile companies maintain churn below 3% monthly.
💰 Calculate Your Retention ROI
See how much revenue you could preserve by reducing churn
Current MRR:
Current Monthly Churn Rate (%):
Target Churn Reduction (%):
Ready to implement these retention features?
ChurnDefense consolidates all 12 must-have customer retention management features into one platform: health scoring, automated playbooks, churn prediction, risk alerts, cohort analysis, and retention dashboards. See how leading SaaS companies reduce churn by 20-40% without adding CS headcount.
Conclusion
Customer retention management features transform reactive churn fighting into proactive retention systems that identify at-risk customers before they cancel and automate intervention workflows at scale.
The 12 must-have features—health scoring, risk alerts, automated playbooks, behavioral segmentation, cohort analysis, engagement tracking, activity timelines, CS workflow automation, exit surveys, retention dashboards, system integrations, and predictive models—work together as a comprehensive system.
Not individual tools.
Choosing the right retention platform requires understanding which features deliver measurable churn reduction versus which create complexity without ROI.
Focus on platforms that integrate health scoring with automated workflows and provide clear measurement of save rates and CS efficiency gains.
Start with foundational features (health scores, alerts, basic playbooks) before adding advanced capabilities (AI prediction, complex segmentation). This phased approach delivers quick wins that build organizational confidence in retention systems.
Effective retention management features pay for themselves within months through reduced churn and improved customer lifetime value.
The difference between manual retention tracking and automated retention systems determines whether SaaS businesses scale profitably or struggle with compounding customer losses.
A 2-percentage-point churn reduction compounds to millions in preserved revenue over years, dwarfing the cost of retention platforms that enable systematic intervention.
📚 Related Resources
Customer Retention Strategy for SaaS
Complete guide to building retention systems from scratch
Churn Prediction Signals
Early warning indicators that predict customer cancellation
Best Customer Retention Software
Platform comparison with feature matrices and pricing
`