
Retention Breakthrough: How Customer Retention Management Software Drives SaaS Growth to ≥ 100 % NRR
Quick answer
Customer retention management software (CRMS) centralizes product usage, billing, and communication data so SaaS teams can spot renewal risks and expansion opportunities automatically. It operationalizes retention through dynamic segmentation, automated onboarding and lifecycle messaging, NRR/GRR dashboards, and customer health scoring. Start with a 30-day pilot on a single phase — onboarding, renewal, or expansion — to prove ROI before scaling, with NRR at or above 100% as the north-star outcome.
Why leading SaaS teams now treat customer retention platforms as their core growth engine.
Get the Retention Software Checklist →
I. Strategic Imperatives for Customer Retention Management
The Business Case for Retention Software
Customer retention management software (CRMS) automates the highest-ROI activity in SaaS: keeping existing revenue. Retaining an existing customer is widely reported to cost several times less than acquiring a new one, and industry analyses have long associated even small retention gains with outsized profit effects. CRMS tools integrate product usage, billing, and communications—helping SaaS leaders identify renewal risks and expansion opportunities automatically.
Retention as a SaaS Growth Engine
Net Revenue Retention (NRR) is the key metric defining SaaS maturity. CRMS platforms make NRR measurable and actionable, linking upsell, contraction, and churn data into one dashboard. Companies that sustain NRR at or above 100 % compound growth meaningfully faster than those below that line.
Mini NRR Calculator
The interactive calculator in the original version of this post boils down to one formula you can run on your own monthly numbers:
NRR = (Starting MRR + Expansion − Contraction − Churned MRR) ÷ Starting MRR × 100
A result at or above 100 % means expansion revenue is outpacing what you lose to contraction and churn. To see where your number lands against your vertical, check the customer retention and churn benchmarks by industry.
II. Foundation: Segmentation, Alignment & Pilots
Dynamic Segmentation through Software
Modern retention tools segment customers by behavior, engagement, and product value—not just ARR. Digital CS layers let enterprise customers choose self-service or guided onboarding within the same platform.
Segmentation Matrix — ARR × Engagement (Expansion Potential)
The original post rendered this as an editable 3 × 3 grid: ARR (low / mid / high) against engagement (low / mid / high), with cell color grading expansion potential from low to very high. The reading is what matters — high-engagement accounts with low or mid ARR are your expansion pipeline, while high-ARR accounts with low engagement are your churn-risk queue. Score each cohort in your CRMS and revisit the grid monthly.
Organizational Alignment via Integrated CRMS
Customer Success and Marketing alignment becomes easier when all customer communications are logged in one CRMS. Avoid “random acts of messaging” by mapping every email, Slack, and in-app notification through a unified system.
Pro tip: Use your CRMS to build a Customer Touchpoint Map — a single view of every automated and manual contact.
Pilot Programs that Prove Value
Start small. Use your retention software to run a pilot in one phase (onboarding, renewal, or expansion). Measure Time-to-Value (TTV) and usage depth; prove ROI fast.
30-Day Digital CS Pilot — Inputs, Metrics & Outcomes
Proving retention ROI with your Customer Retention Management Software (CRMS), stage by stage:
Setup & Planning
Days 0–3. Connect data sources, segment customers, define goals (TTV & NRR targets).
Automation Onboarding
Days 4–10. Enable workflows, automated welcome emails & usage triggers.
Engagement Monitoring
Days 11–20. Track feature adoption, measure depth of use vs control group.
Data Review
Days 21–25. Analyze Time-to-Value (TTV) and retention health scores.
ROI Validation
Days 26–30. Share results — for example, a readout like “15 % faster TTV, +4 pts NRR” — then scale the pilot to more segments.
III. Monitoring, Metrics & Benchmarking
Tracking Churn the Smart Way
Churn analytics inside CRMS platforms distinguish voluntary (cancel) vs involuntary (billing). Automation allows pre-emptive saves (e.g., payment retries). Decision-maker turnover sharply raises churn risk, so multithread engagement is key.
Voluntary vs Involuntary Churn Breakdown
The original interactive chart here illustrated a 65 % / 35 % split between voluntary churn (customer cancellation) and involuntary churn (payment failure). Treat those numbers as placeholders — what matters is that your CRMS charts your actual composition, because each type calls for different automation: saves and re-engagement for voluntary churn, payment retries for involuntary churn.
NRR & GRR Dashboards
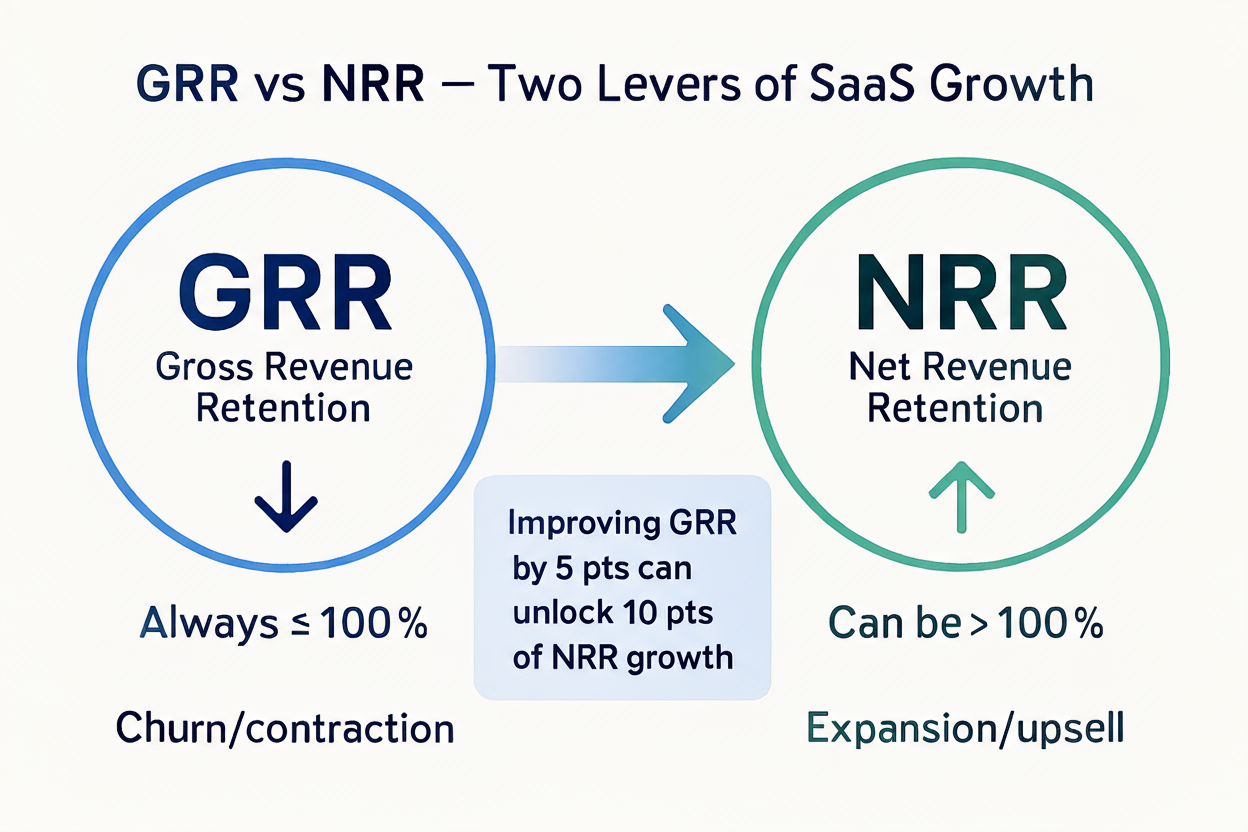
A modern CRMS shows both Gross and Net Revenue Retention side-by-side, helping you identify where revenue grows or leaks. GRR is capped at 100 % and erodes with churn and contraction; NRR can exceed 100 % on expansion and upsell — which is why gains in GRR flow straight through to NRR.
Transactional & CLV Analytics
Retention software should automate key transactional metrics like Returning Customer Rate, AOV, and CLV. Bundling these KPIs within dashboards clarifies whether retention investments truly pay off.
IV. Predictive Health & Customer Feedback
Customer Health Score
A single health score distills product usage, engagement, and billing signals into one at-a-glance number — the original post’s live gauge rendered a 72 % score with a “Healthy” status label. Whatever scale you use, the score is only as useful as the automated actions wired to fire when it dips.
Customer Feedback Loops
Collecting NPS and CSAT inside your retention platform allows automated alerts when loyalty dips. Chart NPS bands against churn rate in your own cohorts — the original post’s illustrative correlation chart made the expected pattern explicit: stronger loyalty scores, lower churn.
V. Digital Customer Success & Engagement
The First 90 Days: Onboarding Excellence
Your retention software should orchestrate personalized onboarding: welcome surveys, job-to-be-done mapping, and guided checklists. Churn is typically at its highest in month one and falls sharply by month three once customers reach early value. For the specific plays, see onboarding to reduce churn.
In-App Guidance & Feature Adoption
Progressive in-app walkthroughs and contextual nudges increase activation rates. Gamification (badges, progress bars) turns onboarding into engagement loops.
Multi-Channel Automation
CRMS platforms integrate chat (Slack, WhatsApp), email, and video. Use automation for lifecycle triggers and re-engagement sequences.
Omnichannel Retention Journey
Trigger → Message → Response → Insight — the loop every automated retention journey runs:
Trigger
An event starts the journey: low usage, failed payment, low NPS, churn risk.
Message
Personalized outreach across multiple channels with perfect timing and tone: email, WhatsApp, in-app, SMS, Slack.
Response
User actions close the loop: opens, clicks, replies, payment retries, booked calls.
Insight
Log outcomes, update the health score, and trigger the next best automated action or playbook.
Support & Self-Service
Combine live chat with a searchable Knowledge Base. A CRMS that hosts these features turns support from a cost center into a loyalty driver.
VI. Proactive Retention & Loyalty Automation
Loyalty Programs and Rewards
Built-in loyalty modules within retention software automate points, referrals, and tier rewards. Unexpected gifts and recognition (Law of Reciprocity) reinforce positive sentiment.
Customer Loyalty Dashboard Preview
What a built-in loyalty module typically surfaces, reproduced from the original post’s interactive preview — all numbers illustrative:
Points Balance
8,420 available · Lifetime 12,300 · Expiring in 30 days: 450 · Redeemed 3,880
Tier & Progress
Gold, 72 % of the way to Platinum. Active earning rules: 2× points on referrals, 1.5× on reviews, birthday bonus.
Recent Activity
| Date | Activity | Channel | Points |
|---|---|---|---|
| Oct 24 | Completed onboarding checklist | In-app | +150 |
| Oct 21 | Wrote review (G2/Play) | +300 | |
| Oct 18 | Referral signup approved | Web | +600 |
| Oct 15 | Redeemed “Pro Plan – $25 off” | Billing | −500 |
Earn Points
- Refer a customer — +600 pts per approved signup
- Write a product review — +300 pts
- Adopt Feature C (3×/week) — +50 pts per milestone
Redeem Rewards
- $25 off — Pro Plan — 500 pts
- Priority Support (30 days) — 800 pts
- Add-on Feature D (1 month) — 1,200 pts
Points Earned — 8 Weeks
Average 1,050 pts/week, peaking at 1,420 pts in week 7 — the cadence view that shows whether the program is actually driving weekly engagement.
Personal Connection Automation
Combine automation with human touch — send milestone messages like “Congrats on your 1,000th transaction!” These reinforce perceived value and drive advocacy.
Customer Inclusion & Value Creation
Use CRMS feedback modules to co-create features and content with users. High-value customers invited to roadmap councils churn less and expand more.
Conclusion
Customer Retention Management Software is now the growth OS of SaaS. It aligns teams, automates engagement, predicts churn, and transforms retention from reactive to proactive. In a market where acquisition costs soar and expansion defines success, CRMS platforms are the clearest path to sustained ≥ 100 % NRR. For the concrete capability checklist to evaluate one, see the must-have customer retention management features.