Onboarding to Reduce Churn: 7 Data-Backed Plays for 2026
Quick answer
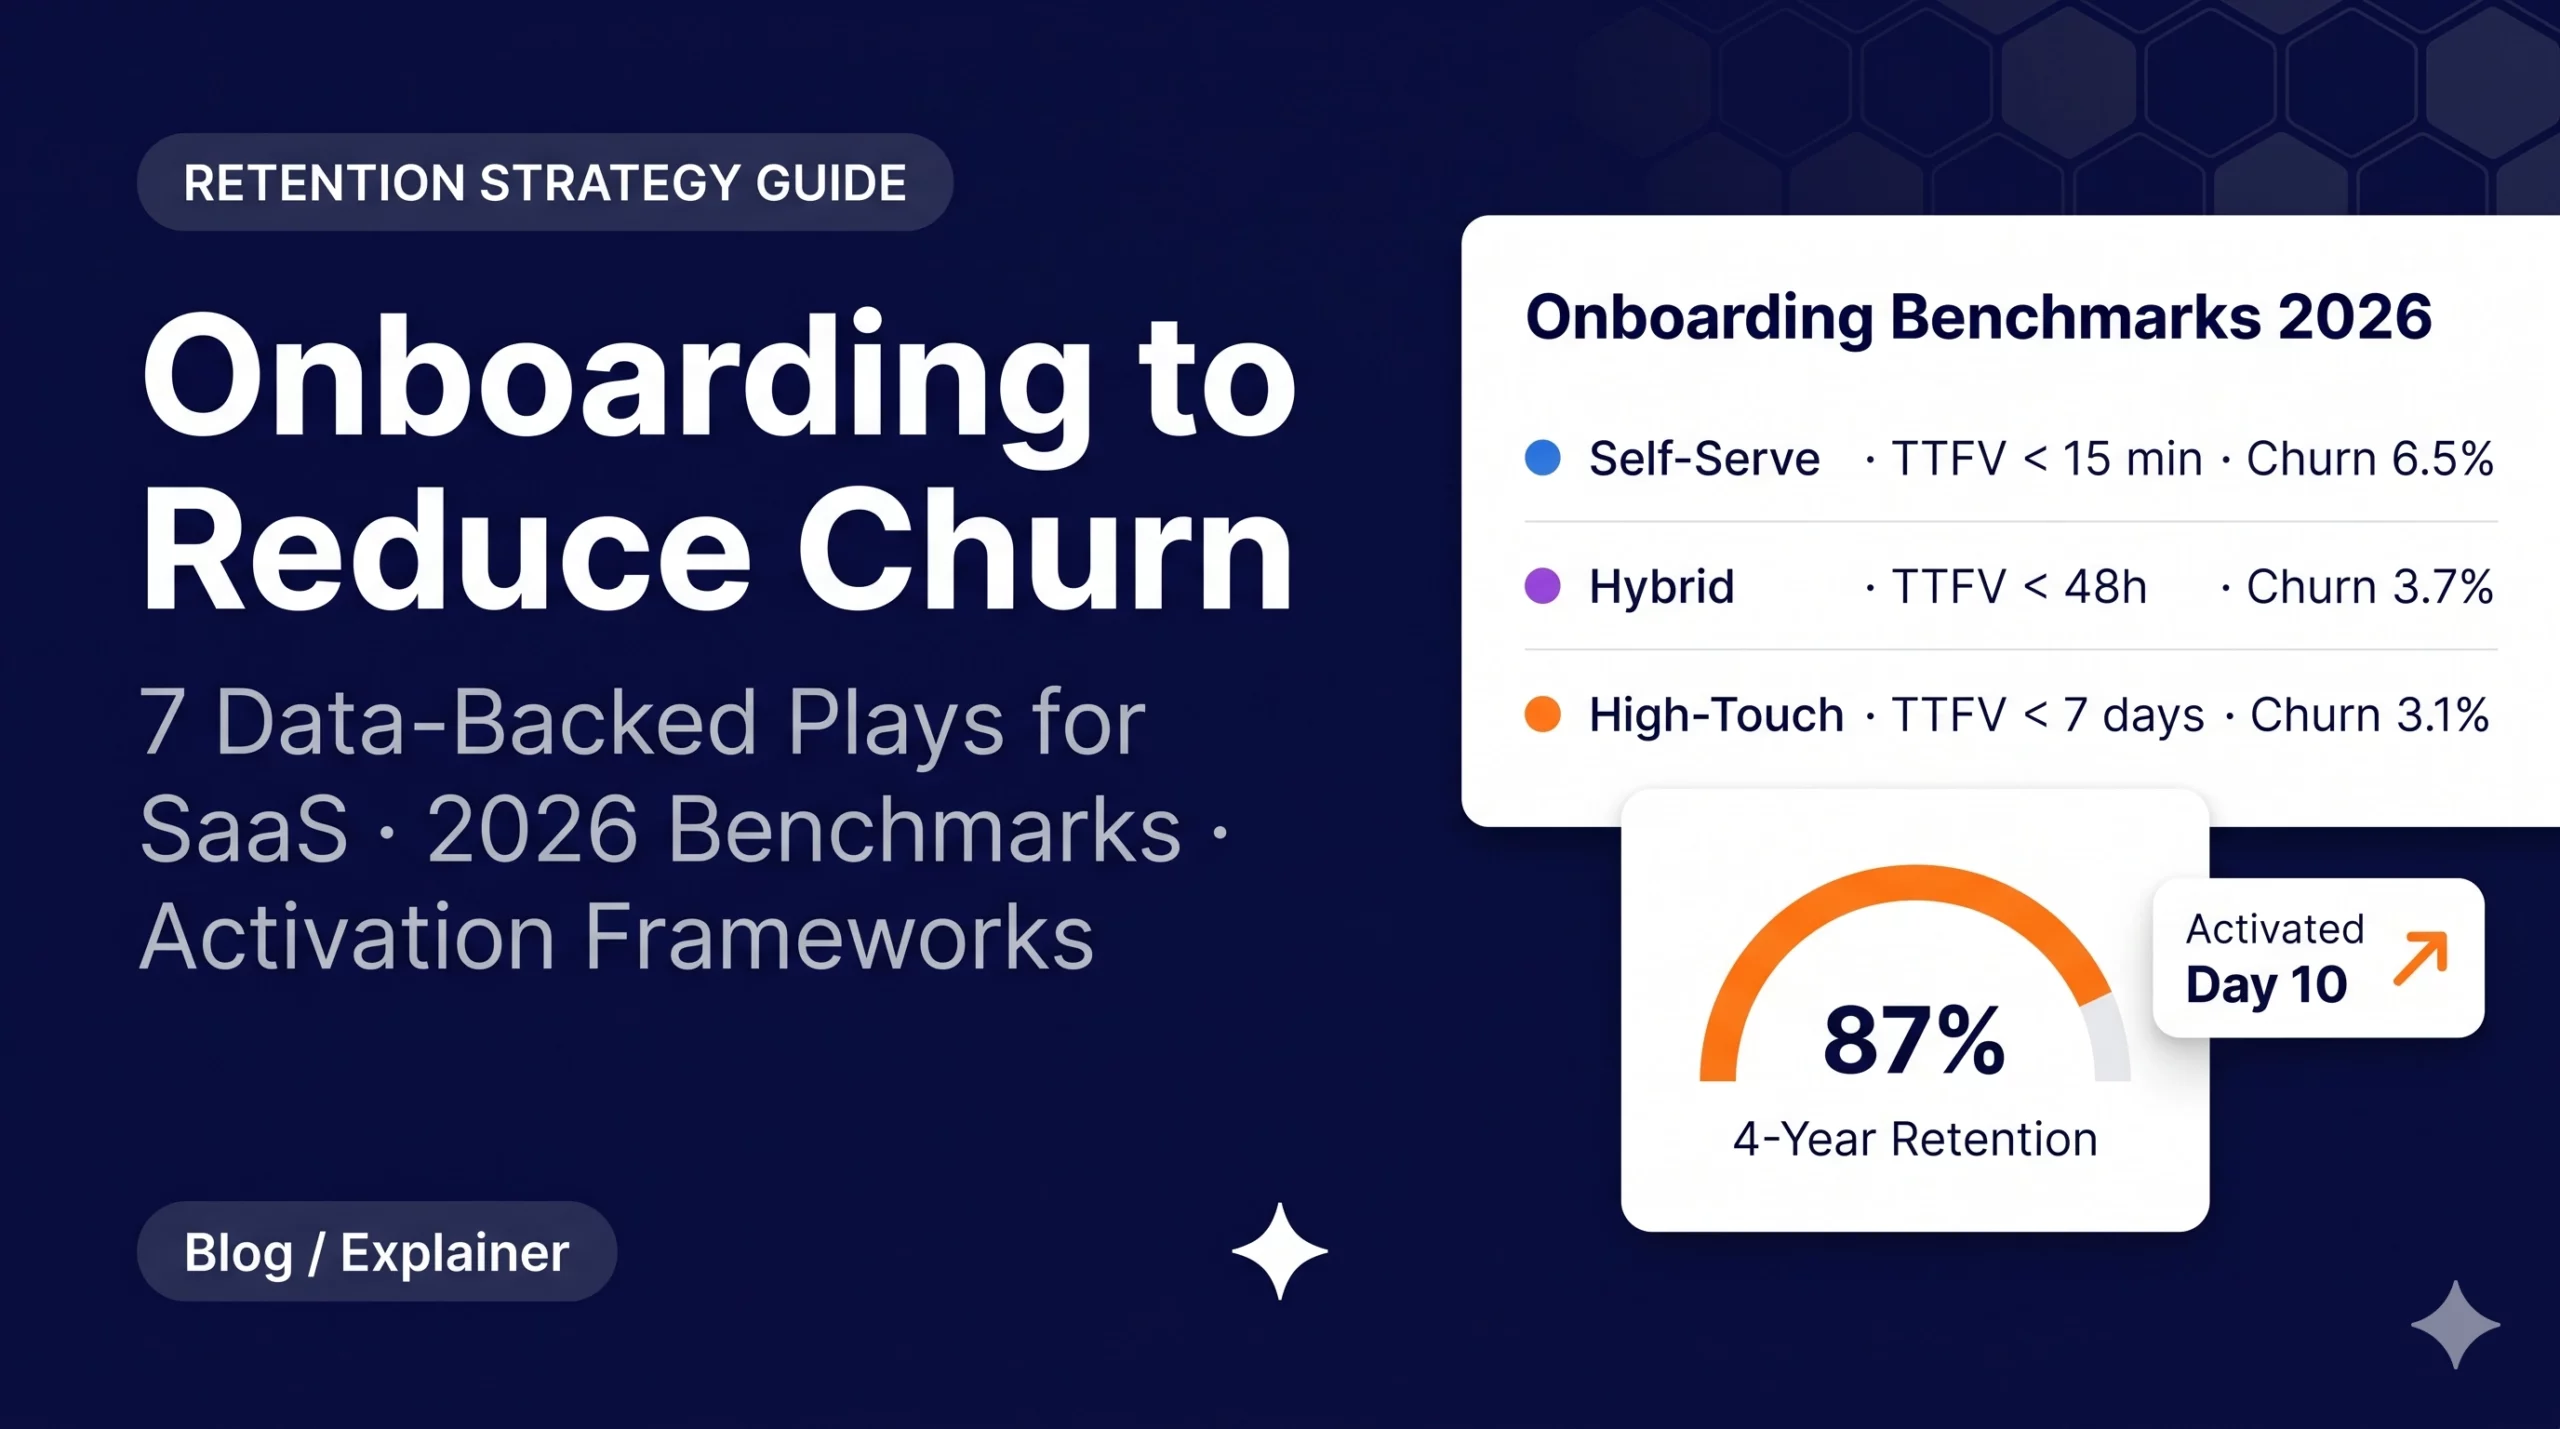
This post details 7 data-backed onboarding plays to reduce churn, sequenced by impact window from Day 1 to Day 90. It emphasizes compressing Time-to-First-Value (TTFV), building activation checklists tied to retention events, and segmenting onboarding by ARPA and user role for maximum retention leverage.
Quick Answer
To use onboarding to reduce churn, focus on three levers: compress time-to-first-value (TTFV) to under 15 minutes, build an activation checklist tied to retention events (not setup steps), and extend onboarding to Day 90 with structured checkpoints. Activated users are 50–80% less likely to churn, and 90% of churn patterns are set within the first 30 days. The 7 plays below are sequenced by impact window: Days 1–3, Week 1–30, and Days 30–90.
Using onboarding to reduce churn is the single highest-leverage move you have to protect Monthly Recurring Revenue (MRR), improve Gross Revenue Retention (GRR), and push Net Revenue Retention (NRR) above the 100% threshold that separates growing SaaS companies from ones slowly bleeding out.
This guide delivers seven concrete onboarding plays, each tied to measurable outcomes: time-to-first-value (TTFV), activation rate, 30/60/90-day retention, and NRR.
You will also find benchmarks segmented by ARR and Average Revenue Per Account (ARPA) so you can set realistic targets for your specific stage, not generic advice written for a hypothetical SaaS company.
Is your onboarding flow protecting or leaking MRR? Benchmark your metrics against similar SaaS companies.
Why Onboarding Is Your Biggest Lever to Reduce Churn
Every conversation about churn eventually circles back to onboarding. Not because onboarding is a magic fix, but because it is the earliest point at which you can observe, measure, and intervene in the behaviors that predict cancellation.
To understand your full churn reduction framework, start with the complete guide to reducing customer churn in B2B SaaS. That pillar covers the entire lifecycle.
This article focuses specifically on the onboarding window, where the leverage is highest and the cost of inaction is most underestimated.
The 30/60/90-Day Churn Timeline
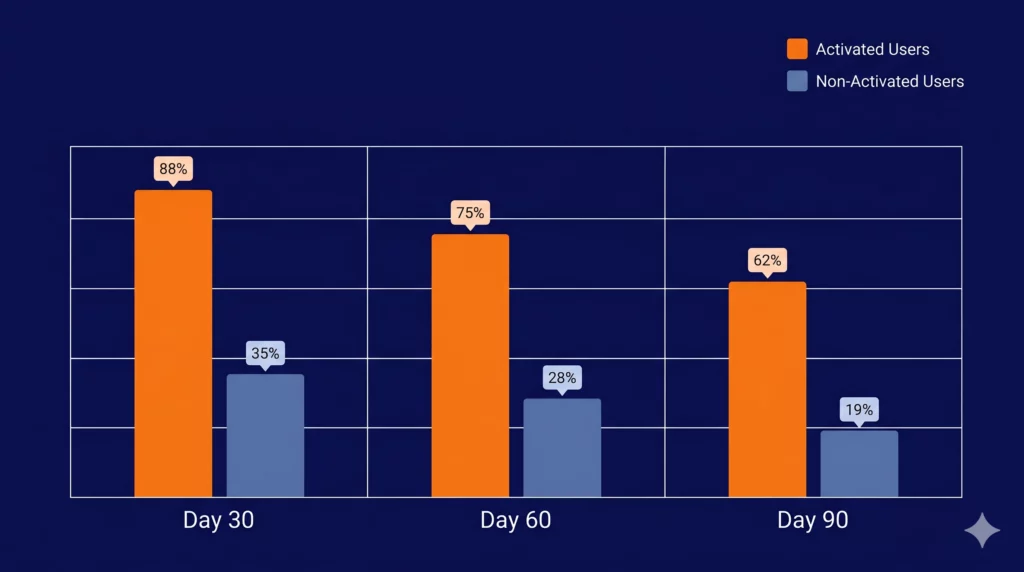
The data on early churn is unambiguous. Some industry analyses suggest that users who activate (meaning they complete at least one core action that delivers perceived value) are significantly less likely to churn than those who do not.
The problem is that most SaaS products define “onboarding complete” as finishing a setup wizard, not as reaching that first value moment.
Here is what happens on a typical timeline when onboarding is weak:
- Day 1: 40–60% of trial users never return after the first session. The product failed to demonstrate value fast enough to justify a second visit.
- Week 1: 70–80% of customers who will eventually churn are already disengaged. Login frequency below three times in the first seven days is a leading indicator of cancellation within 90 days.
- Month 1: 90% of churn patterns are fully established. By day 30, the behavioral trajectory of each account is essentially locked in. Interventions after this point are reactive, not preventive, and considerably more expensive.
Onboarding vs. Late-Stage Retention: A False Trade-Off
Many CS teams invest heavily in Quarterly Business Reviews (QBRs), renewal playbooks, and escalation workflows, only to see churn persist because the problem was established months earlier.
Acquiring a new customer can cost significantly more than retaining an existing one. Pouring that CAC into accounts that churn within 90 days because of a broken onboarding flow is one of the most expensive and correctable mistakes in SaaS.
The implication is straightforward: if you could move 10% of your early-churning customers to “activated,” the downstream effect on GRR, NRR, and LTV (Customer Lifetime Value) compounds over 12–24 months in ways that no late-stage retention play can replicate.
Step 1: Diagnose Your Onboarding and Churn Baseline
Before redesigning a single onboarding step, you need to know where your churn is coming from, not just that it exists.
Most teams skip this diagnostic phase and jump straight into tactics: a new welcome email, a product tour, a Day-7 check-in call.
The result is effort without leverage, because the play does not match the root cause.
Diagnosis answers three questions: Is your churn rate actually a problem relative to your ARR stage and ARPA? Which of the five root causes is driving early-stage churn in your accounts?
And which onboarding metrics are you not yet tracking that would make the root cause visible before cancellation happens?
Benchmark Your Churn by ARR and ARPA
The first step is calibration. A 5% monthly churn rate means something very different for a company at $800K ARR with an ARPA of $30/month than for one at $10M ARR with an ARPA of $600/month.
Without this context, you cannot know whether onboarding is genuinely broken or whether your churn is within a normal range for your segment.
Based on ChartMogul SaaS benchmark data, median monthly customer churn by ARR stage looks like this:
| Segment | ARR Range | Median Monthly Churn | ARPA <$25/mo | ARPA >$500/mo |
|---|---|---|---|---|
| SMB | < $300K | ~6.5% | ~6.1% | ~2.2% |
| Mid-Market | $1M – $3M | ~3.7% | ~6.1% | ~2.2% |
| Growth/Enterprise | > $8M | ~3.1% | ~6.1% | ~2.2% |
The ARPA columns reveal something important: segment by ARR alone is not enough. For industry-specific benchmarks broken down by vertical, see the SaaS churn benchmarks by industry — it covers median churn and NRR across sectors including fintech, HR tech, martech, and more.
The real predictor is ARPA, because it determines how much human intervention is economically justified per account during onboarding.
Map Churn Root Causes to Onboarding Gaps
Once you have your benchmark baseline, the next step is diagnosing which root cause is behind early cancellations. This matters because each root cause requires a different onboarding response.
Treating a Budget Pressure account the same way you treat a Low Product Engagement account wastes both CSM time and the customer’s patience.
The five root causes of SaaS churn, and how each one manifests during the onboarding window:
| Root Cause | Early Signal | Onboarding Play |
|---|---|---|
| Poor Fit / Wrong ICP | Low activation, cancels within 90 days | ICP audit + Day-14 activation health check |
| Low Product Engagement | Usage drop 30+ days before cancellation | Engagement floor alert + CS outreach trigger |
| Budget Pressure | Cost objection in exit survey | Save-offer flow: pause → downgrade → discount |
| Champion Departure | Primary contact inactive 30+ days | Champion inactivity alert + stakeholder re-onboarding |
| Involuntary (Failed Payment) | Payment failure with no intent to cancel | Smart retry + dunning sequence + card updater |
Two of these root causes, Poor Fit and Low Product Engagement, are directly addressable through onboarding design. Champion Departure requires a re-onboarding response.
Budget Pressure and Involuntary churn are less about onboarding and more about save-offer mechanics, though early value communication during onboarding can reduce the perceived cost-vs-value gap that triggers Budget Pressure cancellations later.
The 6 Onboarding Metrics That Predict Churn
Most teams track either too many metrics (and act on none) or track only lagging indicators like monthly churn rate, which tells you what already happened, not what is about to happen.
The six metrics below are leading indicators: they move before churn does, which gives you a window to intervene.
📊 Onboarding Metrics Checklist: Are You Tracking These?
Time-to-First-Value (TTFV) — time from signup to the first action that delivers perceived value. Target: under 15 minutes for simple products, under 48 hours for complex ones. Activation Rate — percentage of new accounts that complete your defined activation milestone. Target: 20–40%+ depending on product complexity. Onboarding Completion Rate — percentage of users who finish the onboarding checklist or flow. Target: above 80% for structured flows. Day-1 / Day-7 / Day-30 Retention — login or meaningful engagement at each checkpoint. Day-7 login frequency below 3x is a reliable leading indicator of 90-day churn. Key Feature Adoption Rate — whether the customer has used the specific feature(s) most correlated with long-term retention in your product. Customer Health Score at Day 30 — a composite signal combining login frequency, feature adoption, and onboarding completion. Accounts below threshold trigger CS outreach before Month 2.
If you are only tracking churn rate and NRR at the company level, you are measuring outcomes, not the behaviors that produce them. The checklist above is your starting point for instrumenting onboarding before running any play.
Step 2: Design Onboarding Journeys by Segment and ARPA
One of the most common onboarding mistakes in SaaS is building a single flow and applying it to every new customer.
A self-funded startup paying $29/month and a mid-market operations team paying $800/month have fundamentally different expectations, timelines, and definitions of “value.”
Sending both through the same four-step wizard and the same welcome email sequence is not onboarding. It is a missed opportunity to differentiate early.
The most durable framework for onboarding design uses two variables: ARPA (to determine how much human investment is economically justified per account) and job-to-be-done (to determine which path through the product delivers the fastest relevant value for that user’s specific goal).
Self-Serve vs. High-Touch: The ARPA Decision Tree
The question of whether to run self-serve or high-touch onboarding is not a philosophy debate. It is a unit economics question.
If your average account pays $40/month, a 60-minute onboarding call costs more than the customer’s first two months of revenue. If your average account pays $1,200/month, the same call pays for itself within the first week of retention it protects.
A practical ARPA-based framework for onboarding motion:
| ARPA Range | Onboarding Motion | Primary Channels | TTFV Target |
|---|---|---|---|
| < $100/mo | Fully self-serve | In-app tours, email sequences, knowledge base | < 15 min |
| $100 – $500/mo | Hybrid (automated + triggered human touch) | Automated flows + CS outreach on risk signals | < 48 hours |
| > $500/mo | High-touch (dedicated CSM) | Kickoff call, structured success plan, QBRs | < 7 days |
The hybrid tier is the most commonly neglected. Teams in the $100–$500/month ARPA range tend to default to fully automated flows (because human touch feels expensive) and then watch mid-segment accounts churn silently at Month 2 or 3, precisely because no one noticed the engagement drop at Day 21.
The correct approach is automation-first with health score triggers: the CS team only intervenes when behavioral signals indicate that the automated flow is not working.
Role- and Goal-Based Onboarding Paths
Even within the same ARPA tier, different users arrive at your product with different jobs-to-be-done.
A marketing manager and a data analyst at the same company both onboard into your platform, but their definition of “first value” is completely different.
A single linear onboarding flow that walks everyone through the same sequence of steps ignores this, and the friction it creates is invisible in aggregate metrics but very visible in individual drop-off analysis.
Goal-based onboarding asks the user one or two questions during signup (role, primary goal, team size, or use case) and then routes them to a personalized checklist and feature path.
The mechanics are simple, but the retention impact is significant: customers who experience an onboarding path relevant to their specific job are more likely to reach activation before Day 14, which is the most predictive window for 90-day retention.
A practical structure for goal-based onboarding:
- Step 1: Collect role and primary goal at signup (2 questions maximum, keep it frictionless)
- Step 2: Serve a personalized checklist of 3–5 actions tied to that goal, not a full product tour
- Step 3: Define role-specific activation: what does “first value” look like for this user type?
- Step 4: Trigger the first in-app celebration or confirmation message when that milestone is reached
The last step is frequently skipped and it matters more than most teams realize. Customers who receive explicit confirmation that they have achieved something meaningful in your product in the first session are significantly more likely to return within 48 hours.
Benchmarks for TTFV, Activation, and Completion
Setting targets without reference points is guesswork. The benchmarks below represent reasonable targets for B2B SaaS across segments, and they serve as the baseline against which your own onboarding experiments should be measured:
⚡ Onboarding Benchmark Targets for B2B SaaS
- Time-to-First-Value: under 15 minutes (self-serve), under 48 hours (hybrid), under 7 days (high-touch)
- Activation Rate: 20–40% of new accounts completing the defined activation event within 14 days
- Onboarding Completion Rate: above 80% for structured, checklist-driven flows
- Day-7 Login Frequency: 3 or more sessions in the first 7 days as a minimum threshold
- 90-Day Churn Rate (activated accounts): 50–80% lower than non-activated accounts at the same ARR stage
Some industry data suggests that customers who reach their first success milestone quickly tend to retain at much higher rates in the long term than those who do not.
That gap is not a product quality problem. It is an onboarding design problem, and it is entirely correctable with the right segmentation and path architecture.
For a broader look at how onboarding fits within your overall retention operating system, see the full SaaS customer retention strategy guide — it covers the lifecycle plays that extend well beyond the first 90 days.
Step 3: The 7 Onboarding Plays That Actually Reduce Churn
The plays below are sequenced by impact window, not by complexity. Plays 1–3 operate in the first 24–72 hours and target the Day-1 drop-off problem. Plays 4–5 cover the Week-1 to Day-30 window, where disengagement silently accelerates.
Plays 6–7 extend onboarding into the 30–90 day range, where most teams have already stopped paying attention but where a significant share of preventable churn is still being decided.
Each play includes the root cause it addresses, the metric it moves, and the minimum viable implementation, so you can prioritize based on your current baseline.
Play 1: Compress Time-to-First-Value Below One Core Action
The single highest-impact change most SaaS products can make to their onboarding is removing steps between signup and the first moment of perceived value.
Most onboarding flows are designed around product completeness (show everything the product can do) rather than user urgency (get the user to one meaningful outcome as fast as possible).
Root cause addressed: Poor Fit / Wrong ICP, Low Product Engagement
Metric moved: TTFV, Day-1 retention
Target: First value moment under 15 minutes for self-serve products
To implement this play, map every step currently between signup and your defined activation event. For each step, ask one question: does removing or deferring this step break the path to first value, or does it just feel necessary because it has always been there?
Account setup, billing confirmation, team invitation, and profile completion are almost always deferrable. The activation event itself — the first report generated, the first integration connected, the first task completed — is not.
Companies that redesign onboarding with this lens typically reduce step count by 40–60% without losing any functionality, and early churn drops proportionally.
Play 2: Build an Activation Checklist Tied to Retention Events
An activation checklist is not a setup wizard. A setup wizard asks users to configure the product. An activation checklist guides users to the specific actions that your retention data shows are most correlated with long-term engagement.
Root cause addressed: Low Product Engagement
Metric moved: Activation rate, onboarding completion rate, 30-day retention
Target: 3–5 checklist items, each tied to a measurable retention event
The distinction matters because it changes what goes on the list. If your data shows that customers who connect at least one integration in the first week retain at 2x the rate of those who do not, then “Connect your first integration” belongs on the checklist. “Upload your company logo” almost certainly does not.
A well-designed activation checklist for B2B SaaS typically contains:
- One data or integration action (connecting a source, importing existing data, or syncing a tool)
- One core workflow action (completing the primary task the product is built around)
- One collaboration or sharing action (inviting a teammate, sharing a report, or publishing something)
- One outcome confirmation (viewing a result, generating a first output, or receiving a first notification)
Checklists with more than five items see sharply declining completion rates. Keep it short, keep each item tied to a real retention signal, and display progress visually so the user feels momentum building rather than a list growing.
Play 3: Use Smart Empty States, Not Blank Canvases
Empty states are one of the most underinvested surfaces in SaaS onboarding.
When a new user lands on a dashboard, a project view, or a report screen for the first time and sees nothing, their immediate cognitive reaction is “I don’t know what to do next.” That friction does not announce itself as an onboarding failure. It just results in a tab being closed.
Root cause addressed: Low Product Engagement, Poor Fit
Metric moved: Day-1 return rate, TTFV
Target: Every empty state replaced with a guided prompt or sample content
A smart empty state does one of two things: it either shows the user what the screen will look like when it has data (reducing cognitive uncertainty) or it gives the user one specific action to take to populate it (reducing friction).
Ideally it does both. Sample data, pre-filled templates, and contextual tooltips on empty canvases are the three most effective implementations.
The benchmark for why this matters: 40–60% of trial users never return after their first session.
For a meaningful portion of those users, the decision point is a blank screen that gave them no clear next step in a moment when motivation was high but orientation was low.
Play 4: Orchestrate Milestone-Based Email Sequences
Most onboarding email sequences are time-based: Day 1, Day 3, Day 7. The problem with time-based sequences is that they ignore where the user actually is in the product. A Day-7 “Are you getting value?” email sent to a user who activated on Day 2 is irrelevant.
The same email sent to a user who has not logged in since signup is too late and too generic to move behavior.
Root cause addressed: Low Product Engagement, Budget Pressure (early value communication)
Metric moved: Onboarding completion rate, Day-14 activation, 90-day churn
Target: Replace time-based sequences with behavior-triggered emails
Milestone-based sequences use product events, not calendar days, as triggers. The architecture looks like this:
| Trigger Event | Email Goal | Fallback (if event not reached) |
|---|---|---|
| Signup (immediate) | Set context, reduce first-login friction | — |
| First activation event completed | Celebrate milestone, suggest next action | Day-3 re-engagement if event not reached |
| Key feature adopted | Deepen usage, introduce related feature | Day-7 nudge toward that feature |
| No login for 5+ days | Re-engage with a specific, low-friction prompt | CS outreach trigger for hybrid/high-touch accounts |
| Full onboarding checklist completed | Confirm activated status, introduce expansion path | Day-14 health check sequence for incomplete accounts |
The fallback column is the part most teams skip. Every milestone-based sequence needs a parallel “not reached” branch that escalates or re-engages, because a triggered email that never fires because the user never took the action is silent churn in progress.
Play 5: Trigger Proactive CS Outreach on Health Score Drops
For hybrid and high-touch accounts, automated sequences alone are not enough. The difference between a customer who churns at Month 3 and one who stays for three years is often a single well-timed human conversation that happened (or did not happen) at Day 21.
Root cause addressed: Low Product Engagement, Budget Pressure
Metric moved: 30-day health score, 90-day retention, NRR
Target: CS outreach triggered within 48 hours of an account falling below health score threshold
A Day-30 health score model for onboarding typically combines three signals:
- Login frequency in the last 14 days (weighted most heavily)
- Onboarding checklist completion percentage at Day 30
- Key feature adoption: whether the one or two features most correlated with retention have been used at least once
Accounts that fall below a defined threshold (typically a composite score below 40 on a 100-point scale) receive a CS outreach trigger.
For teams using a structured retention platform, this trigger feeds directly into a CS task queue with account context attached, so the CSM does not need to manually monitor every account’s health.
The outreach itself should be short, specific, and tied to a concrete next step — not a generic check-in, but a targeted “I noticed you haven’t connected your CRM yet — here’s how that unlocks the reports your team signed up for.”
Play 6: Re-Onboard After Champion Departure
Champion Departure is one of the most underestimated churn vectors in B2B SaaS, and it is almost never addressed during the onboarding phase.
When the primary contact who championed the purchase leaves the company, the replacement often has no context for the tool, no relationship with the CSM, and no internal incentive to continue a subscription their predecessor bought.
Root cause addressed: Champion Departure
Metric moved: Logo churn rate, 90-day retention post-champion-change
Target: New stakeholder re-onboarding initiated within 7 days of champion inactivity signal
The signal to watch is primary contact inactivity for 30 or more days in an otherwise active account. When this pattern appears, the play is not a standard check-in — it is a structured re-onboarding sequence for the new stakeholder:
- Day 1 of signal: CS outreach to reintroduce the product and identify the new champion
- Day 3: A condensed onboarding session (30 minutes, not the full original onboarding) focused on the outcomes the account has already achieved
- Day 7: A written summary of current usage, value delivered to date, and a recommended next step
This play is referenced in the full churn reduction strategies guide for B2B SaaS alongside other lifecycle retention plays that extend beyond the onboarding window.
Play 7: Extend Onboarding to Day 90, Not Just Day 7
Most SaaS onboarding ends at the wrong moment. The welcome sequence runs for 7–14 days, the product tour completes, the checklist closes, and the customer is considered “onboarded.”
However, research consistently shows that the behavioral patterns determining long-term retention continue forming through Day 30 and are not fully established until Day 90.
Root cause addressed: Low Product Engagement, Budget Pressure
Metric moved: 60-day and 90-day retention, GRR, NRR
Target: Structured touchpoints at Day 30, 60, and 90 for all accounts above hybrid ARPA threshold
A Day 30/60/90 onboarding extension does not require full CSM coverage for every account. For self-serve accounts, it means automated milestone emails and in-app prompts tied to second-layer feature adoption.
For hybrid and high-touch accounts, it means a structured success review at each checkpoint with three agenda items: value delivered to date, gaps in usage relative to the customer’s original goal, and one specific action to close that gap before the next checkpoint.
The compounding effect of this play on NRR is meaningful. Companies with NRR above 100% are growing even if they acquire no new customers, because expansion revenue from deeply activated accounts outpaces churn from disengaged ones.
Getting customers to Day 90 in an activated, engaged state is the prerequisite for that expansion to happen.
See how these 7 plays map to your retention metrics. Benchmark activation rate and 90-day churn at your ARR stage.
Step 4: Measure the Impact of Onboarding on MRR and NRR
Redesigning onboarding without a measurement framework is the equivalent of running an experiment with no control group.
You may see churn drop in the months after a change, but you will not know which play drove the improvement, whether it holds across cohorts, or how to replicate it at the next stage of growth.
This section covers the minimum viable dashboard for connecting onboarding metrics to revenue outcomes, and the formula that translates a reduction in 90-day churn into a concrete MRR and NRR impact.
The Onboarding-to-Revenue Measurement Stack
Track these metrics in two layers: leading indicators (onboarding behaviors that predict churn before it happens) and lagging outcomes (the revenue metrics that confirm whether onboarding is working at scale).
| Layer | Metric | Healthy Target | Review Cadence |
|---|---|---|---|
| Leading | TTFV (Time-to-First-Value) | <15 min (self-serve) / <48h (hybrid) | Weekly |
| Activation Rate (Day 14) | 20–40%+ | Weekly | |
| Health Score at Day 30 | >60/100 composite | Weekly | |
| Lagging | 90-Day Logo Churn Rate | Below your ARR-segment benchmark | Monthly |
| Gross Revenue Retention (GRR) | >90% annually | Monthly | |
| Net Revenue Retention (NRR) | >100% (top quartile: 110–120%) | Monthly | |
| MRR Churned from <90-Day Accounts | Declining month-over-month | Monthly |
The leading metrics tell you whether your onboarding plays are working in real time. The lagging metrics confirm whether those behavioral improvements are translating into revenue protection at scale.
Both layers are necessary: optimizing only for activation rate without watching GRR is like steering by a compass but ignoring the map.
The MRR Saved Formula
To build a business case for investing in onboarding improvements, use this formula to quantify the revenue impact of reducing 90-day churn:
💰 MRR Saved by Reducing 90-Day Churn
MRR Saved = (Churn Rate Before − Churn Rate After) × New Customers/Month × ARPA
Example: A company with 80 new customers/month, ARPA of $500, and 90-day churn dropping from 15% to 10%:
(15% − 10%) × 80 × $500 = $2,000 MRR saved per month = $24,000 ARR protected annually
That $24,000 ARR figure compounds. Retained customers expand, refer, and provide case studies. They do not incur re-acquisition costs.
And when NRR climbs above 100% because activated customers are expanding rather than contracting, the growth rate on a fixed acquisition budget accelerates significantly.
Bessemer Venture Partners and OpenView data consistently show that SaaS companies with NRR above 110% grow 1.5–3x faster than those below 100%, primarily because they are not spending acquisition budget to replace churned MRR.
For a deeper look at how to calculate and benchmark your own churn rate across segments, the SaaS churn rate formula guide and the how to calculate SaaS churn rate walk through the mechanics step by step.
ChurnDefense
Turn these plays into a measurable retention system
See how CS teams benchmark onboarding metrics, track health scores, and connect activation data to MRR and NRR — all in one place.